Role
Data Visualization Designer and Analyst
TIMELINE
5 months
What happens when the world stops growing?
We used to fear overpopulation. Today, a different anxiety is taking hold — one shaped by shrinking birth rates, aging populations, and questions about who bears the burden of demographic change. This project invites readers to explore those questions through data visualization and story.
We used to fear overpopulation. Today, a different anxiety is taking hold — one shaped by shrinking birth rates, aging populations, and questions about who bears the burden of demographic change. This project invites readers to explore those questions through data visualization and story.
purpose
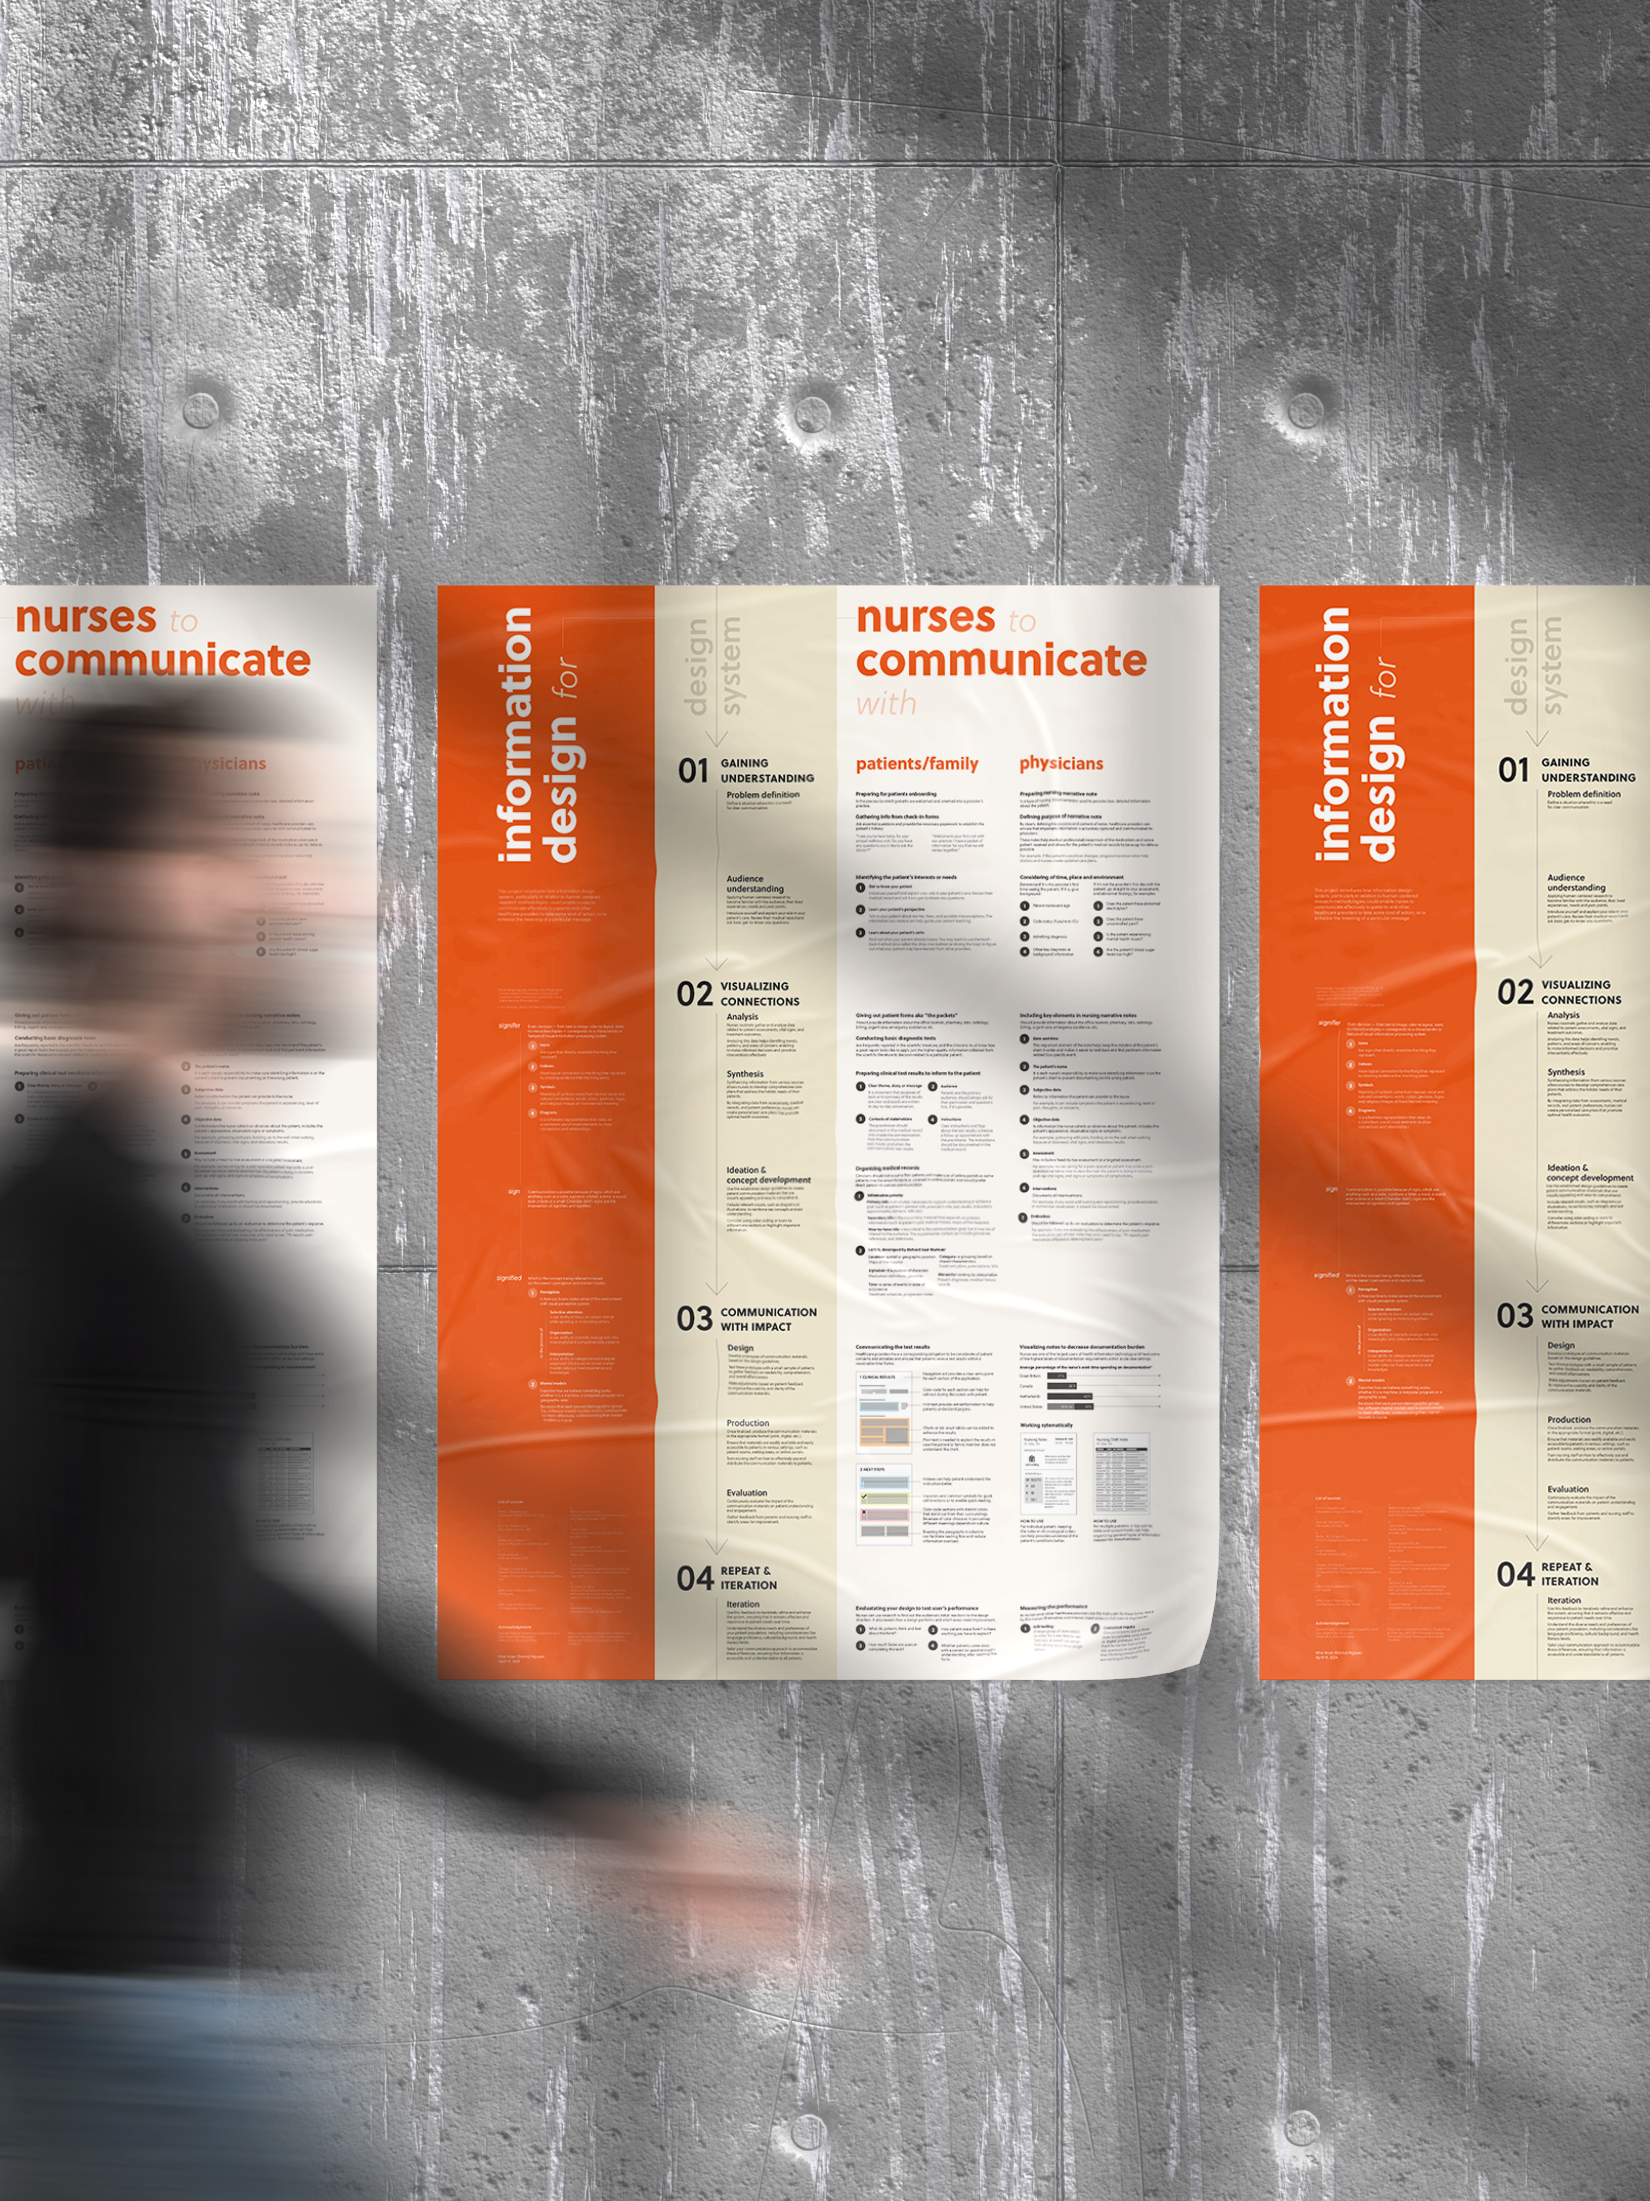
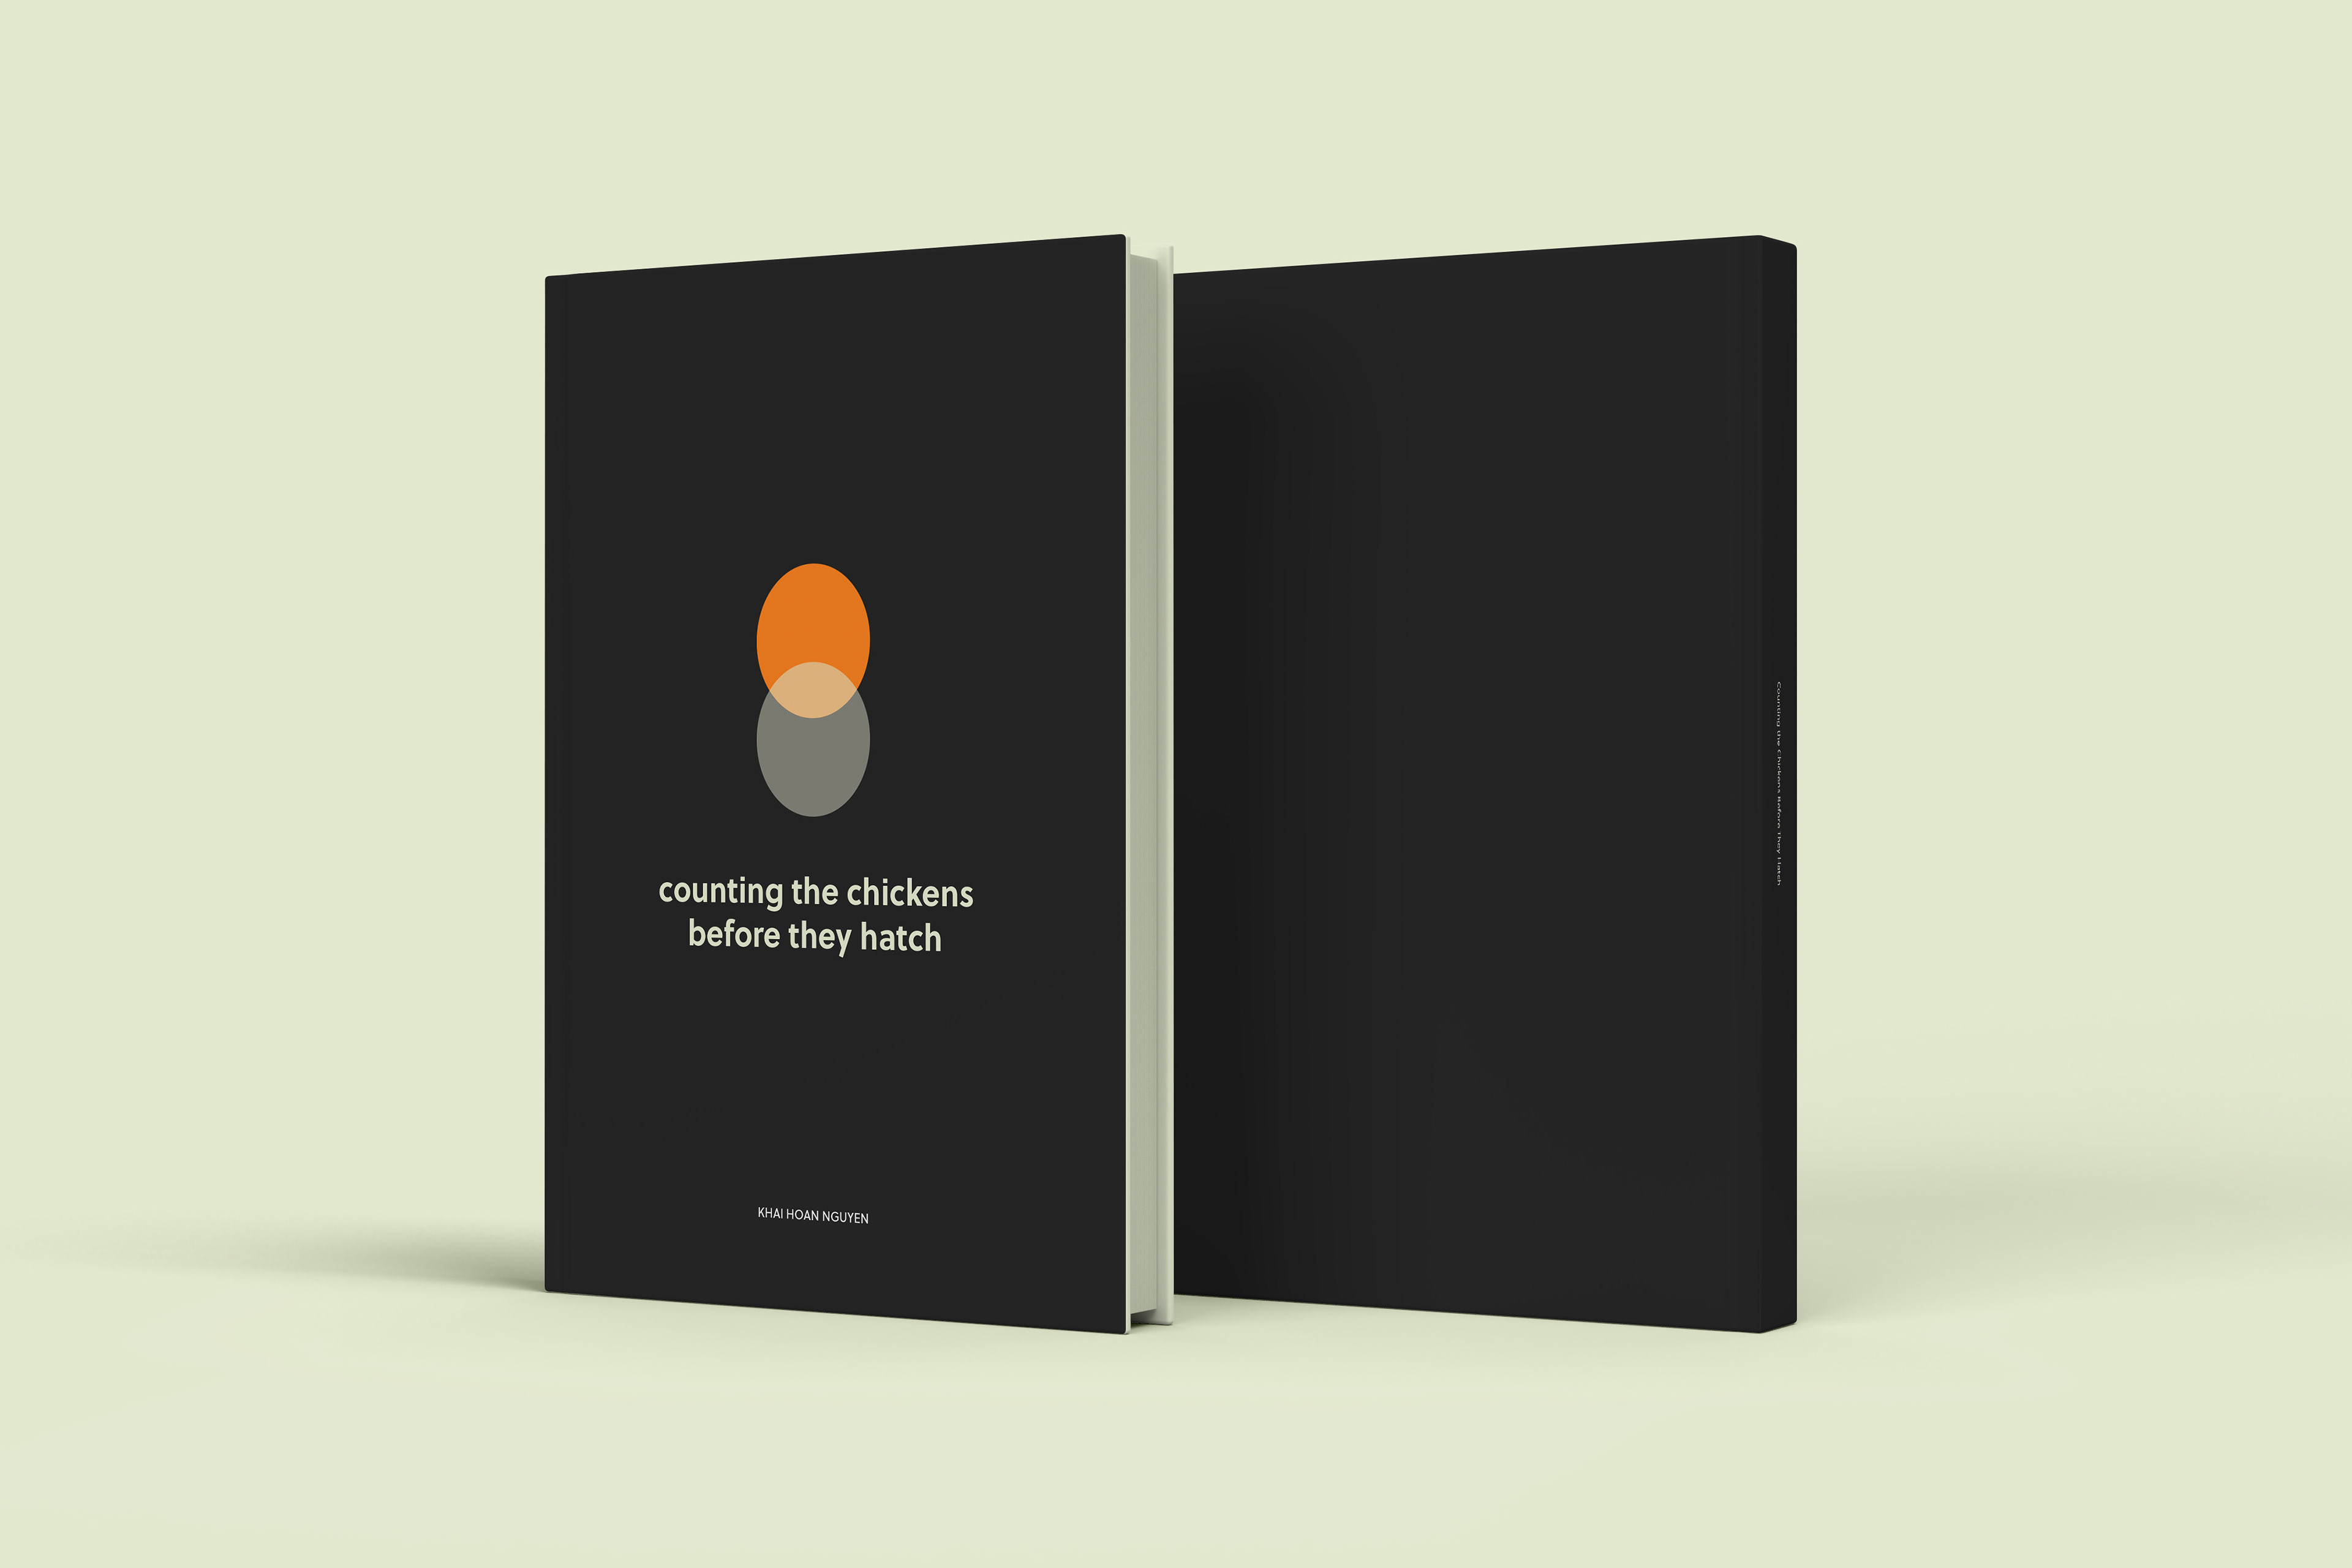
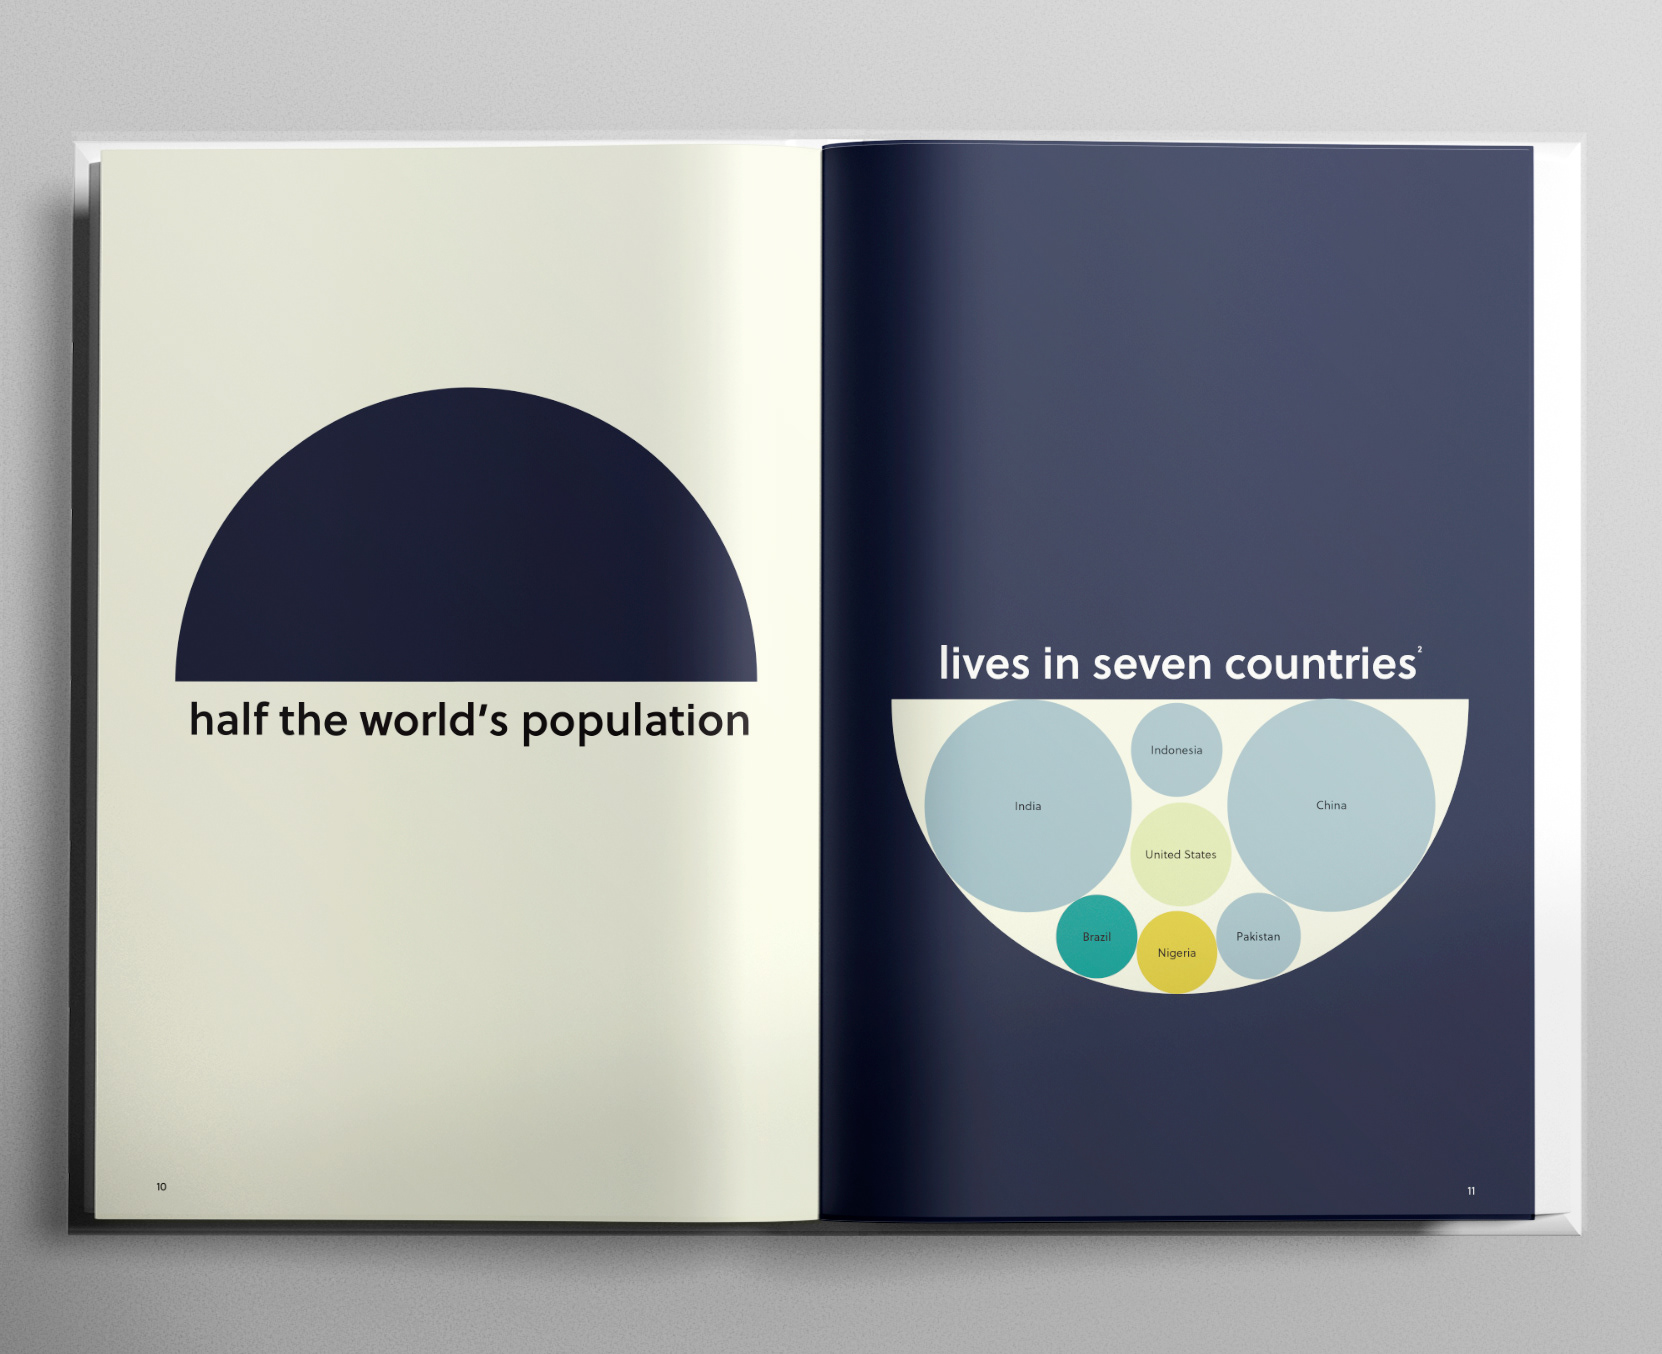
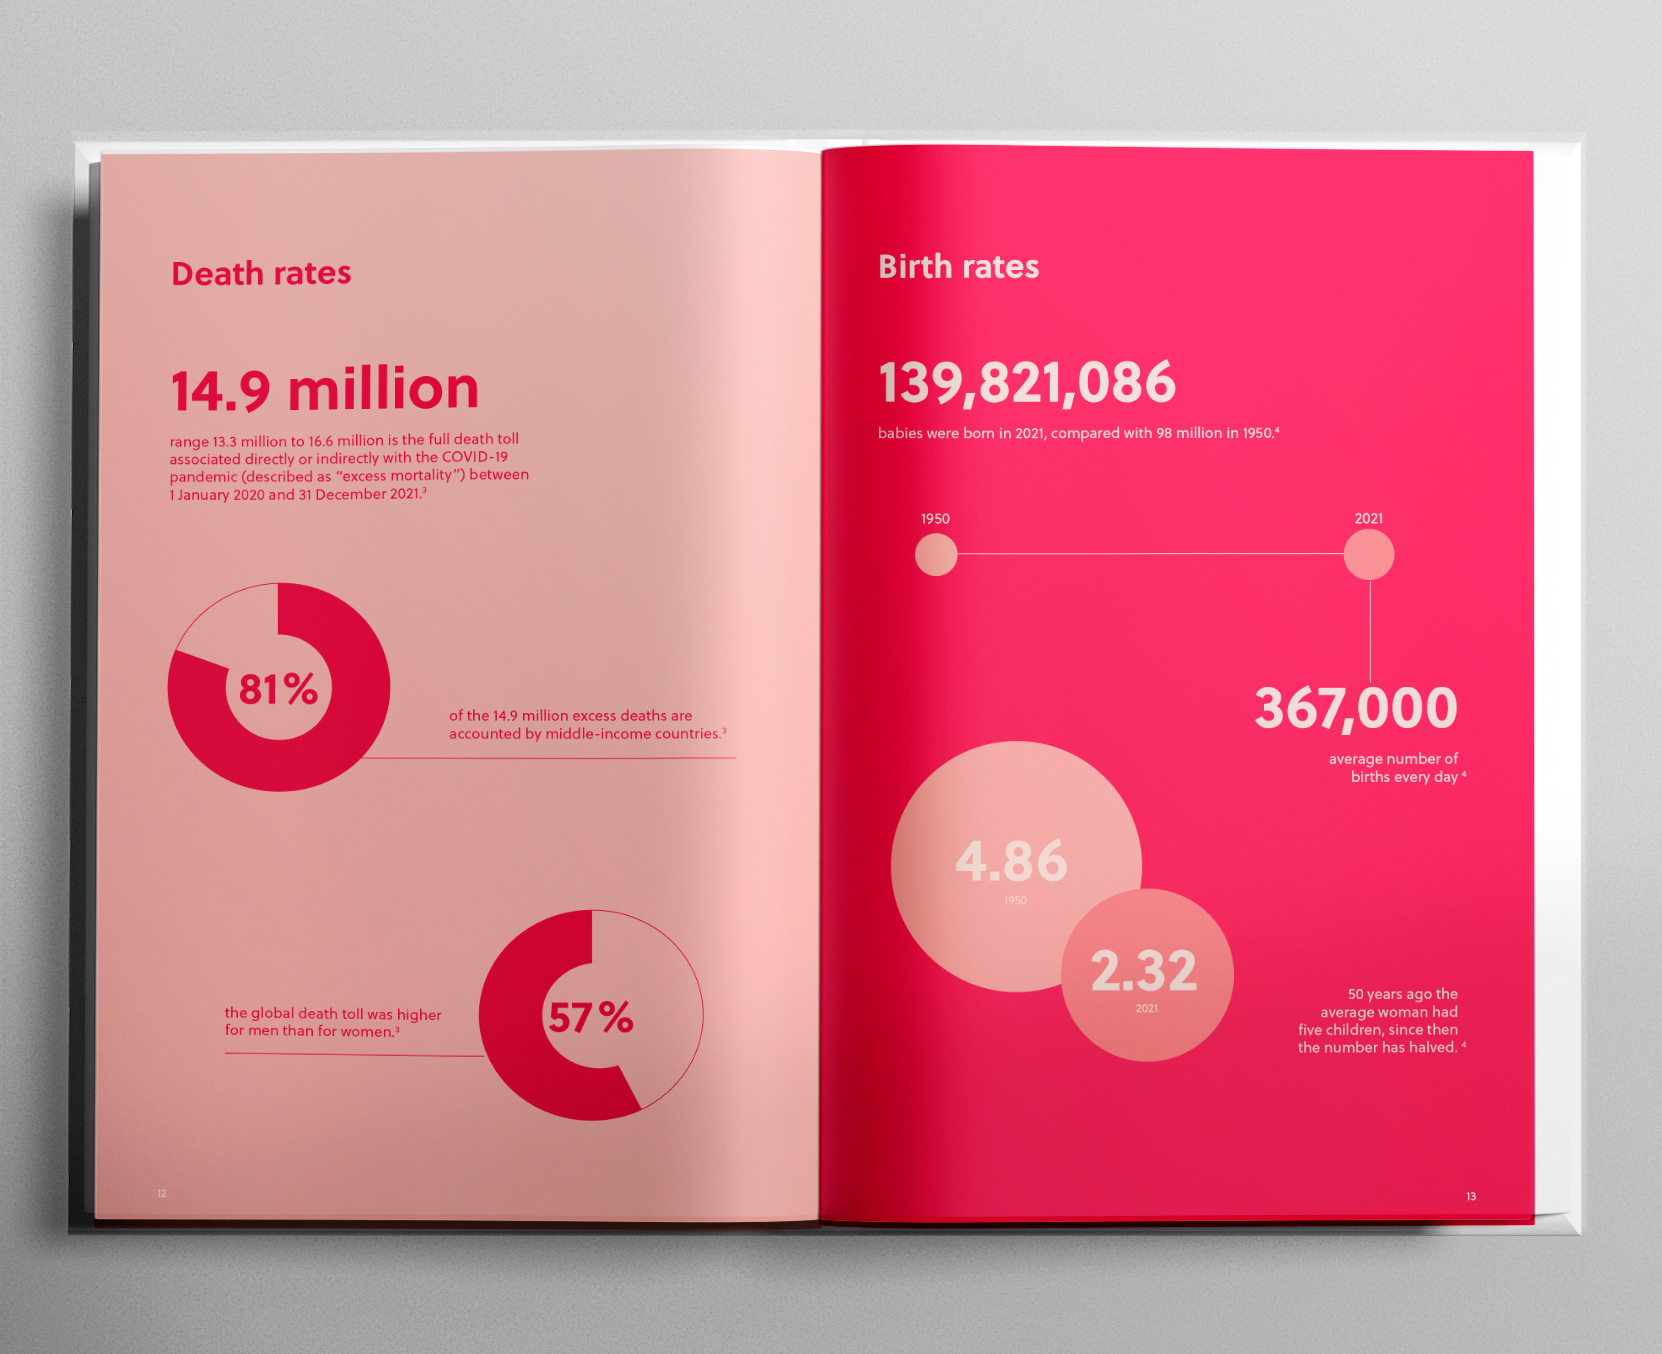
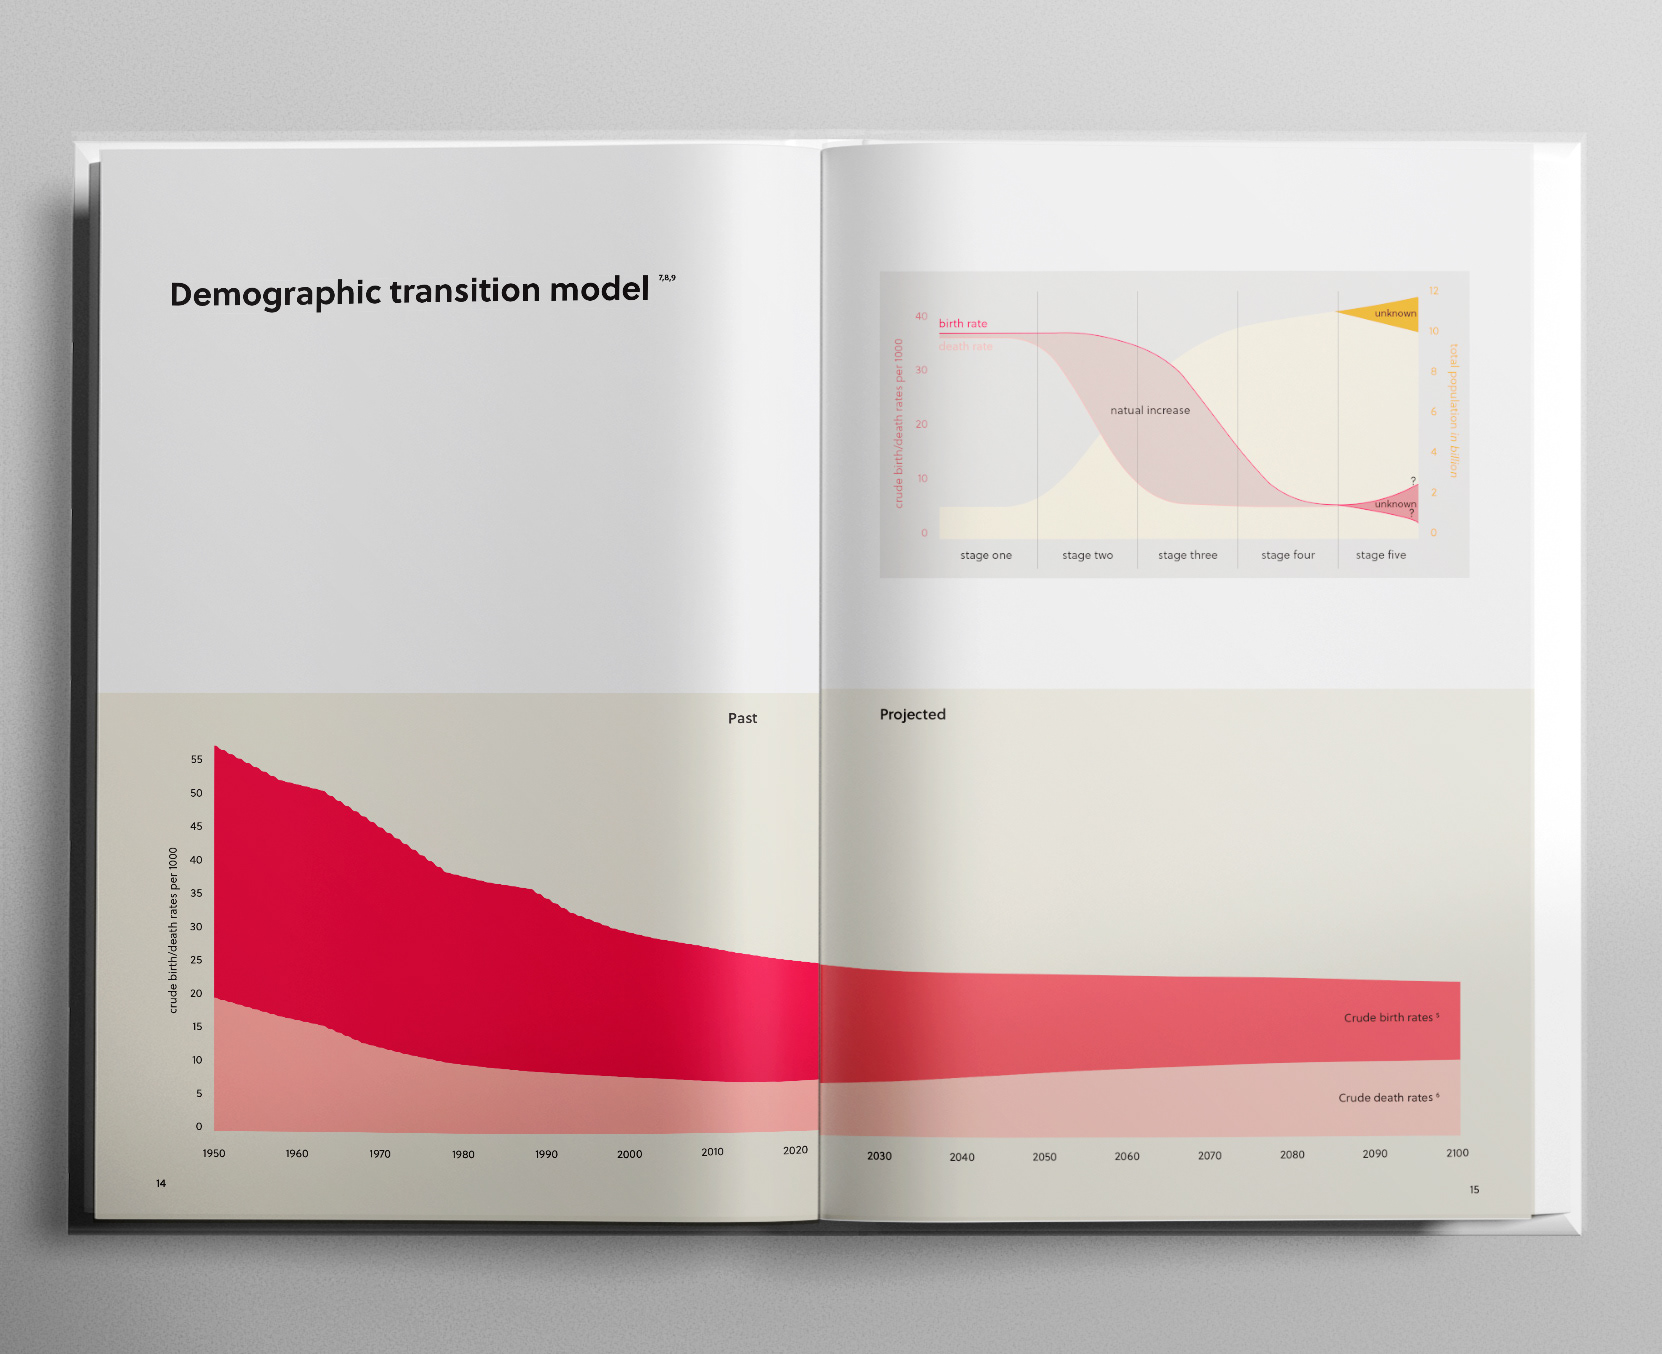
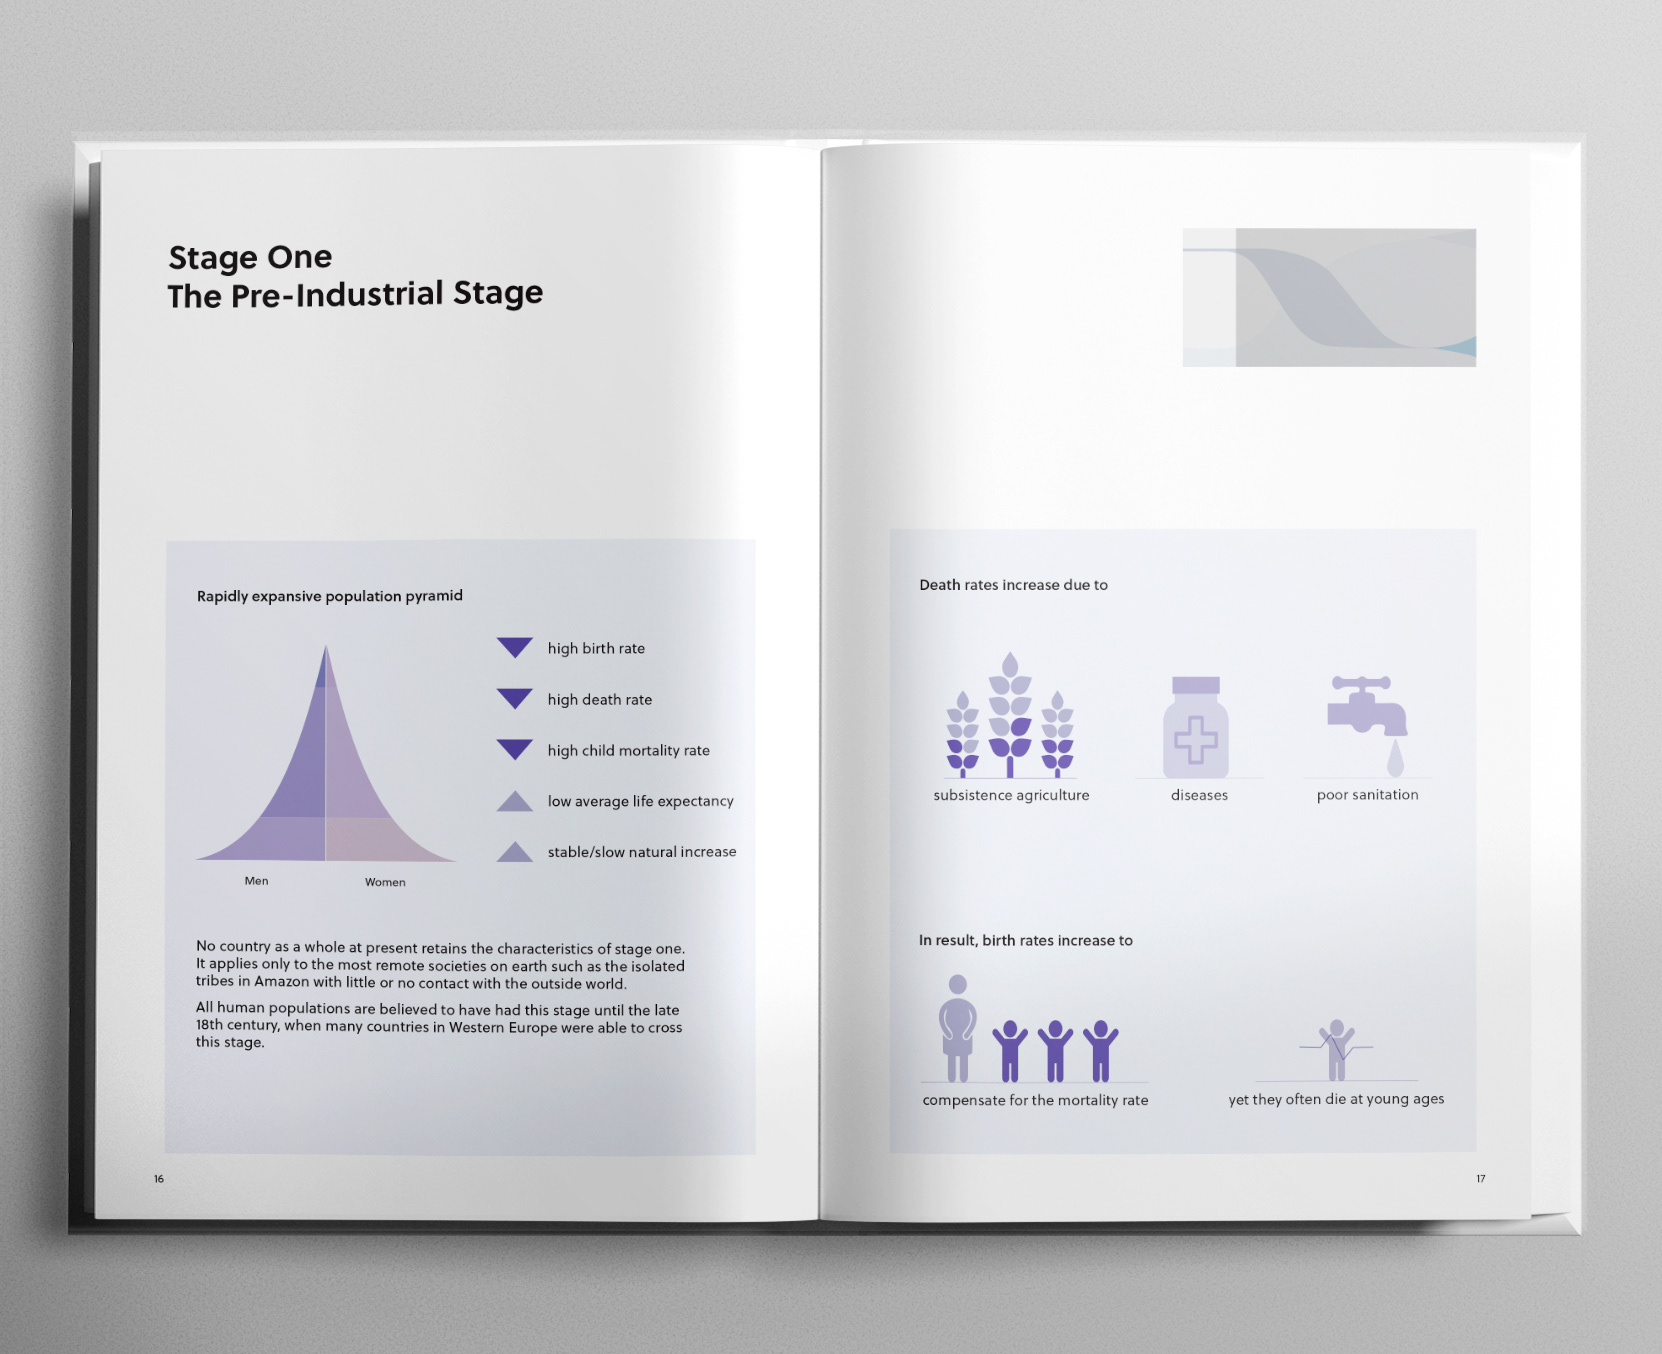
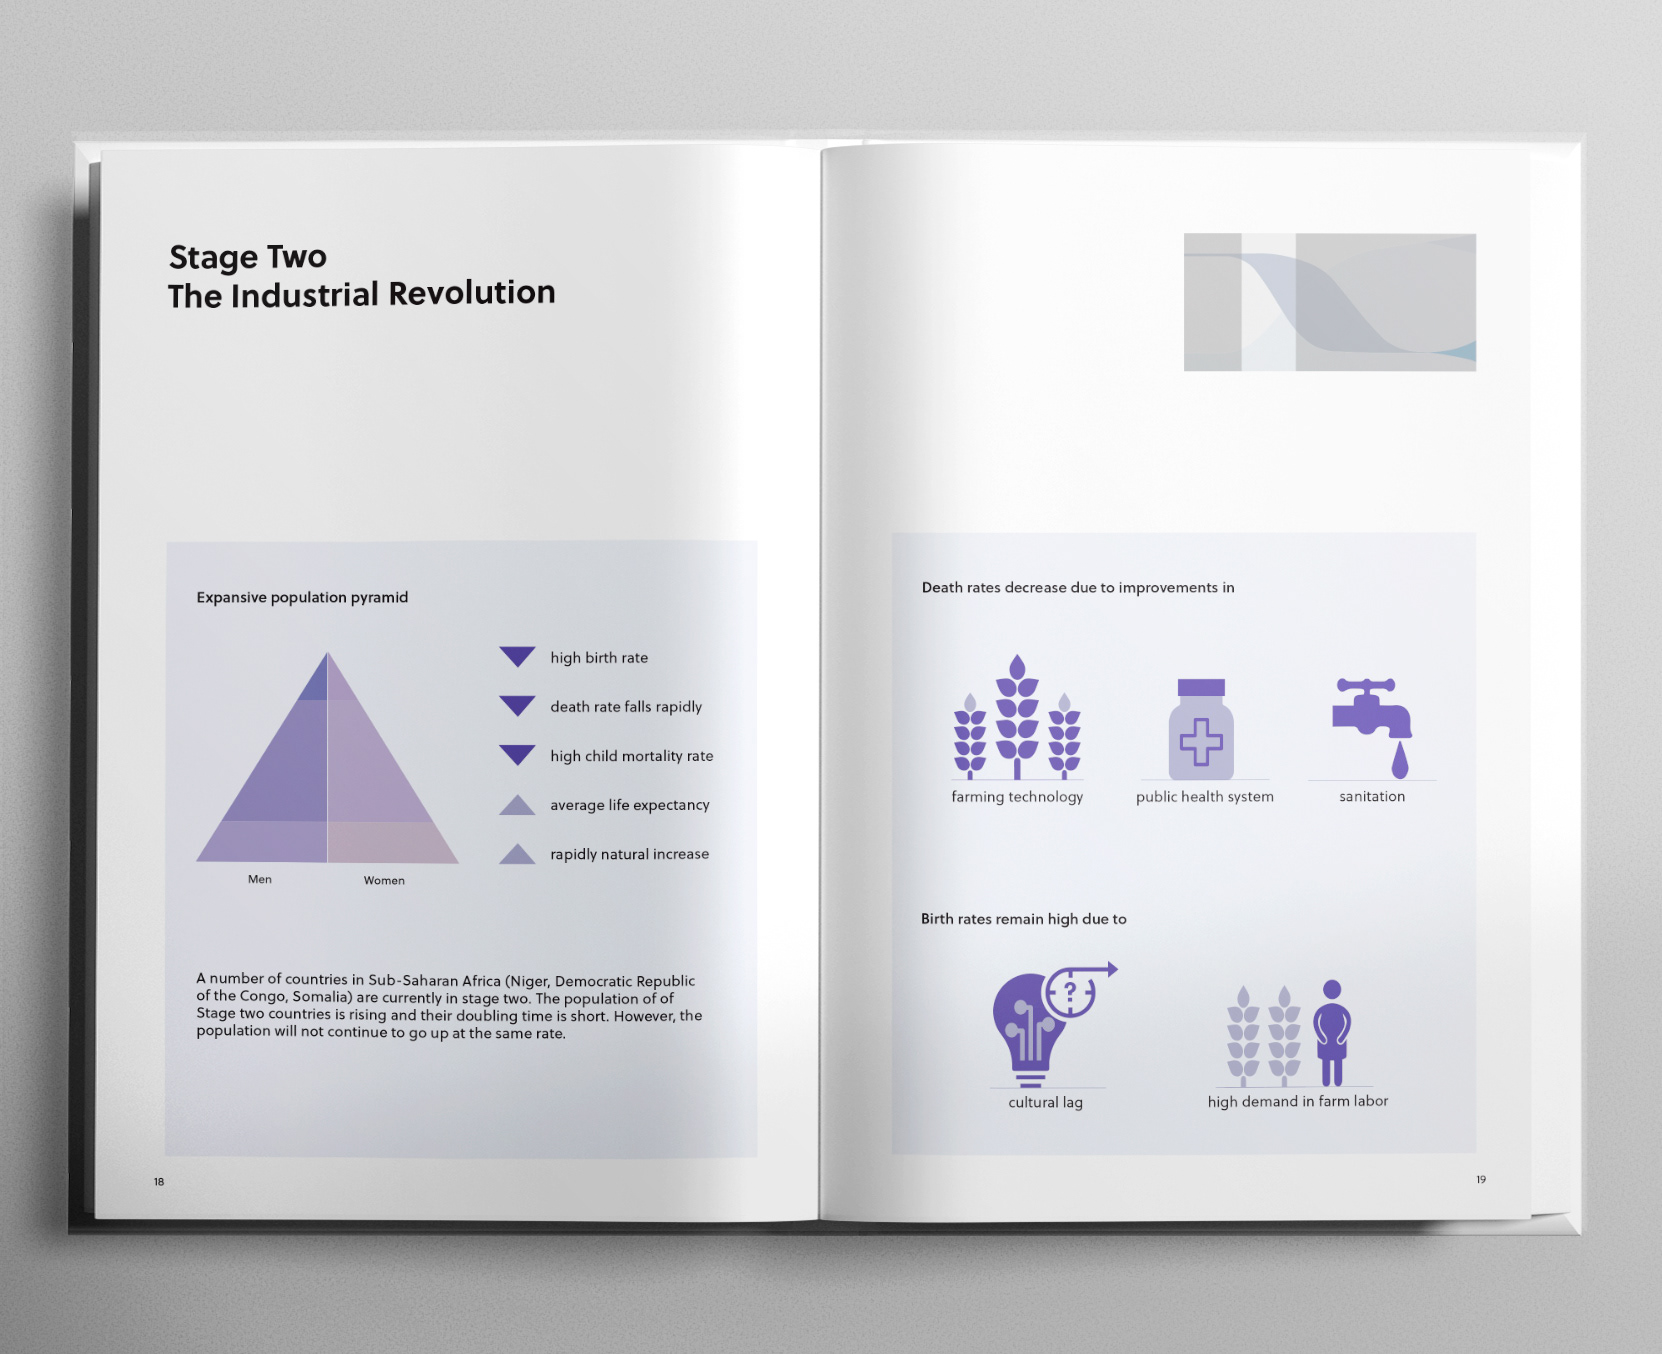
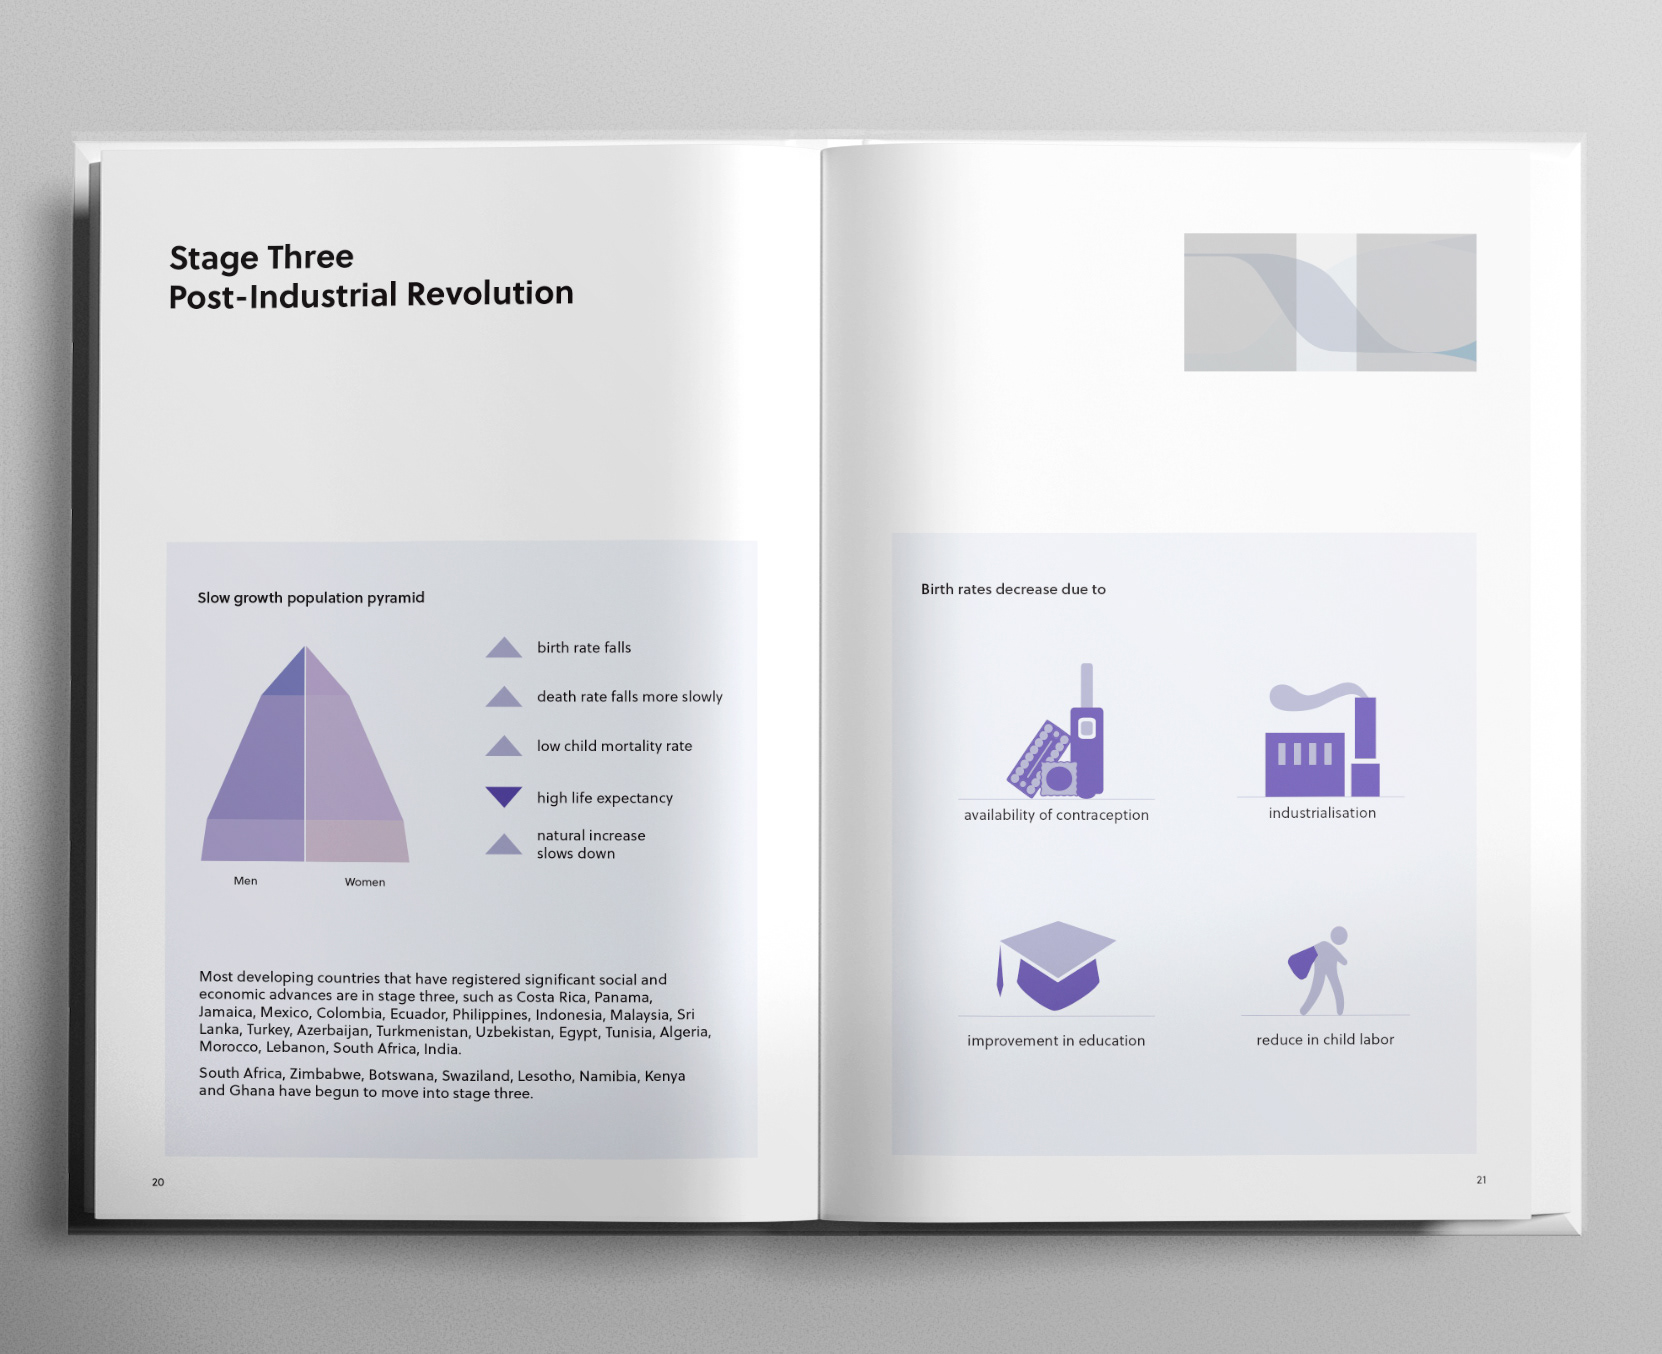
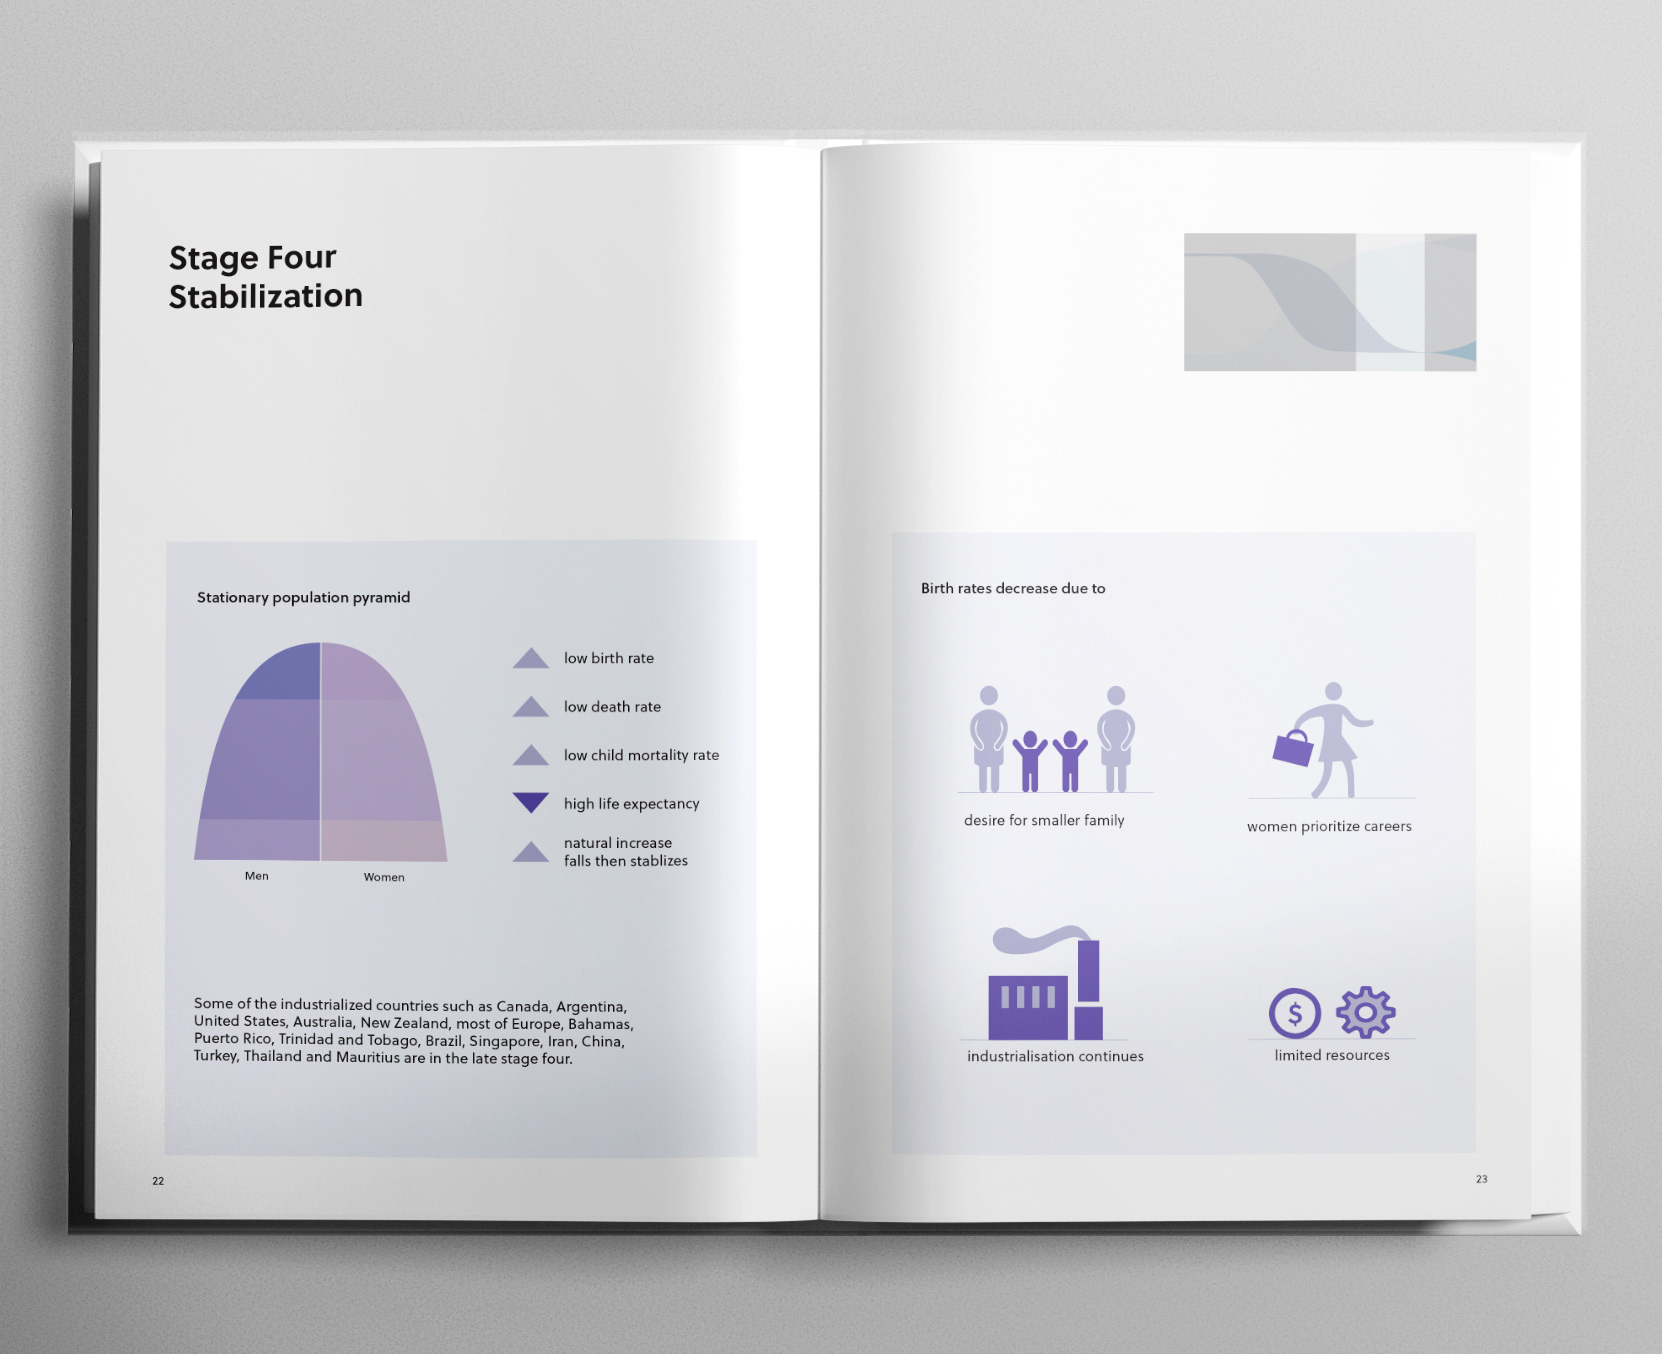
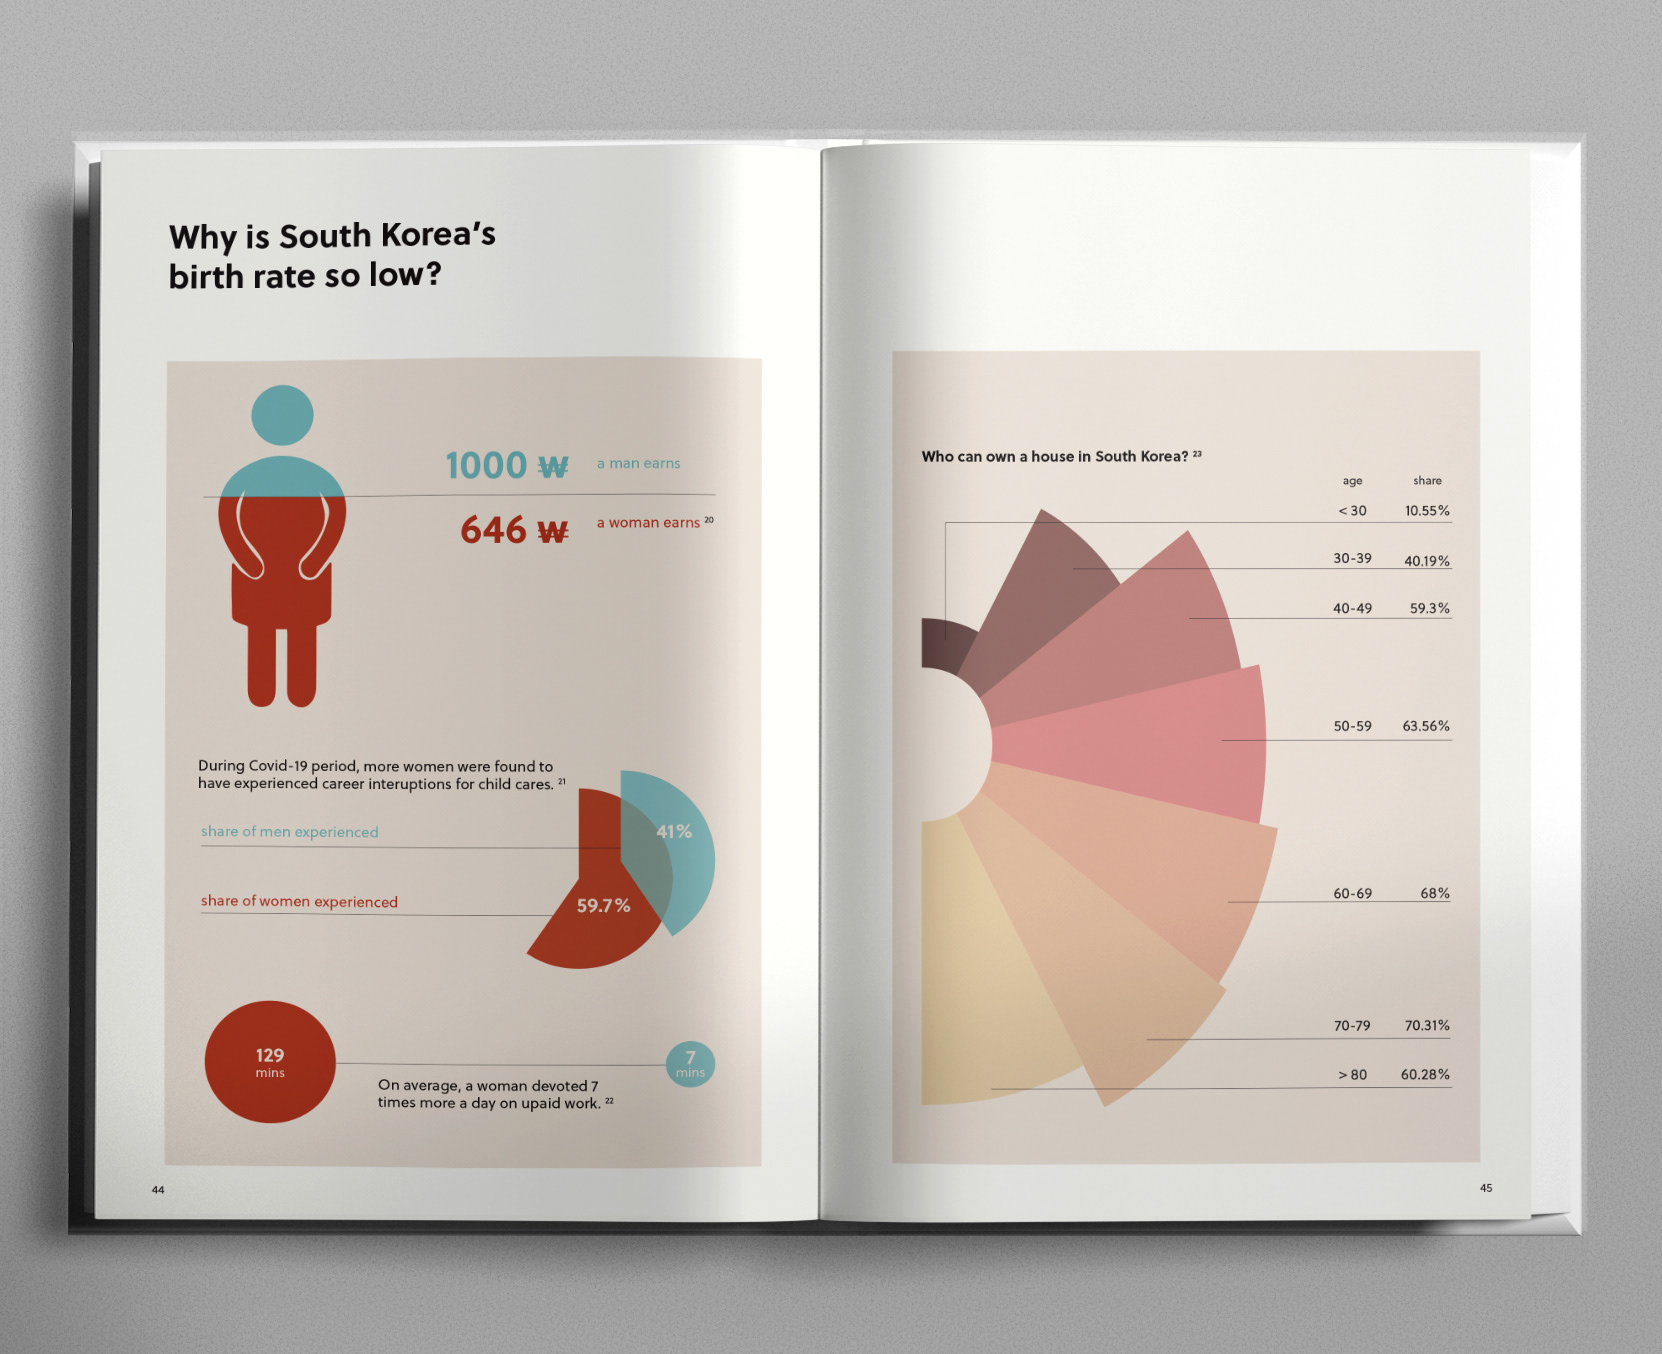
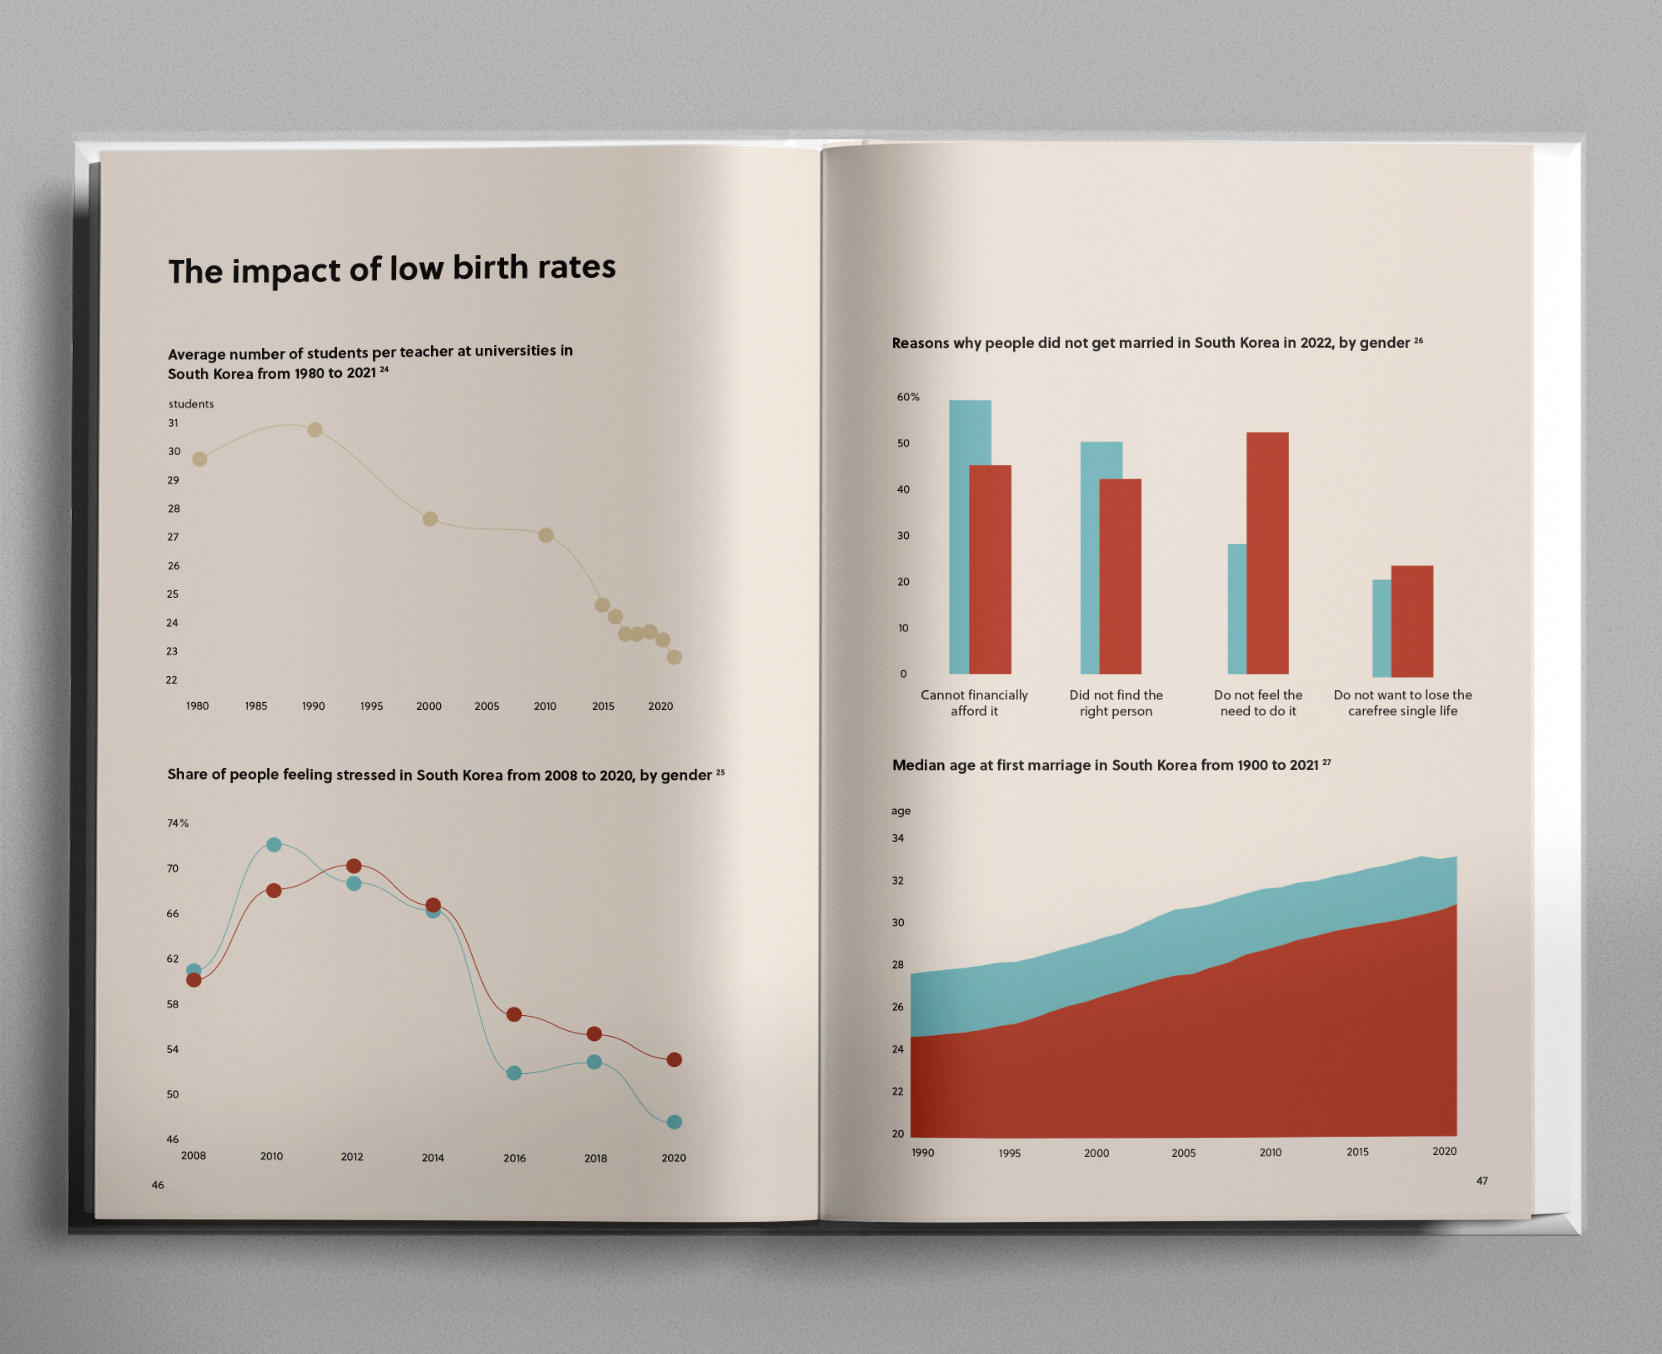
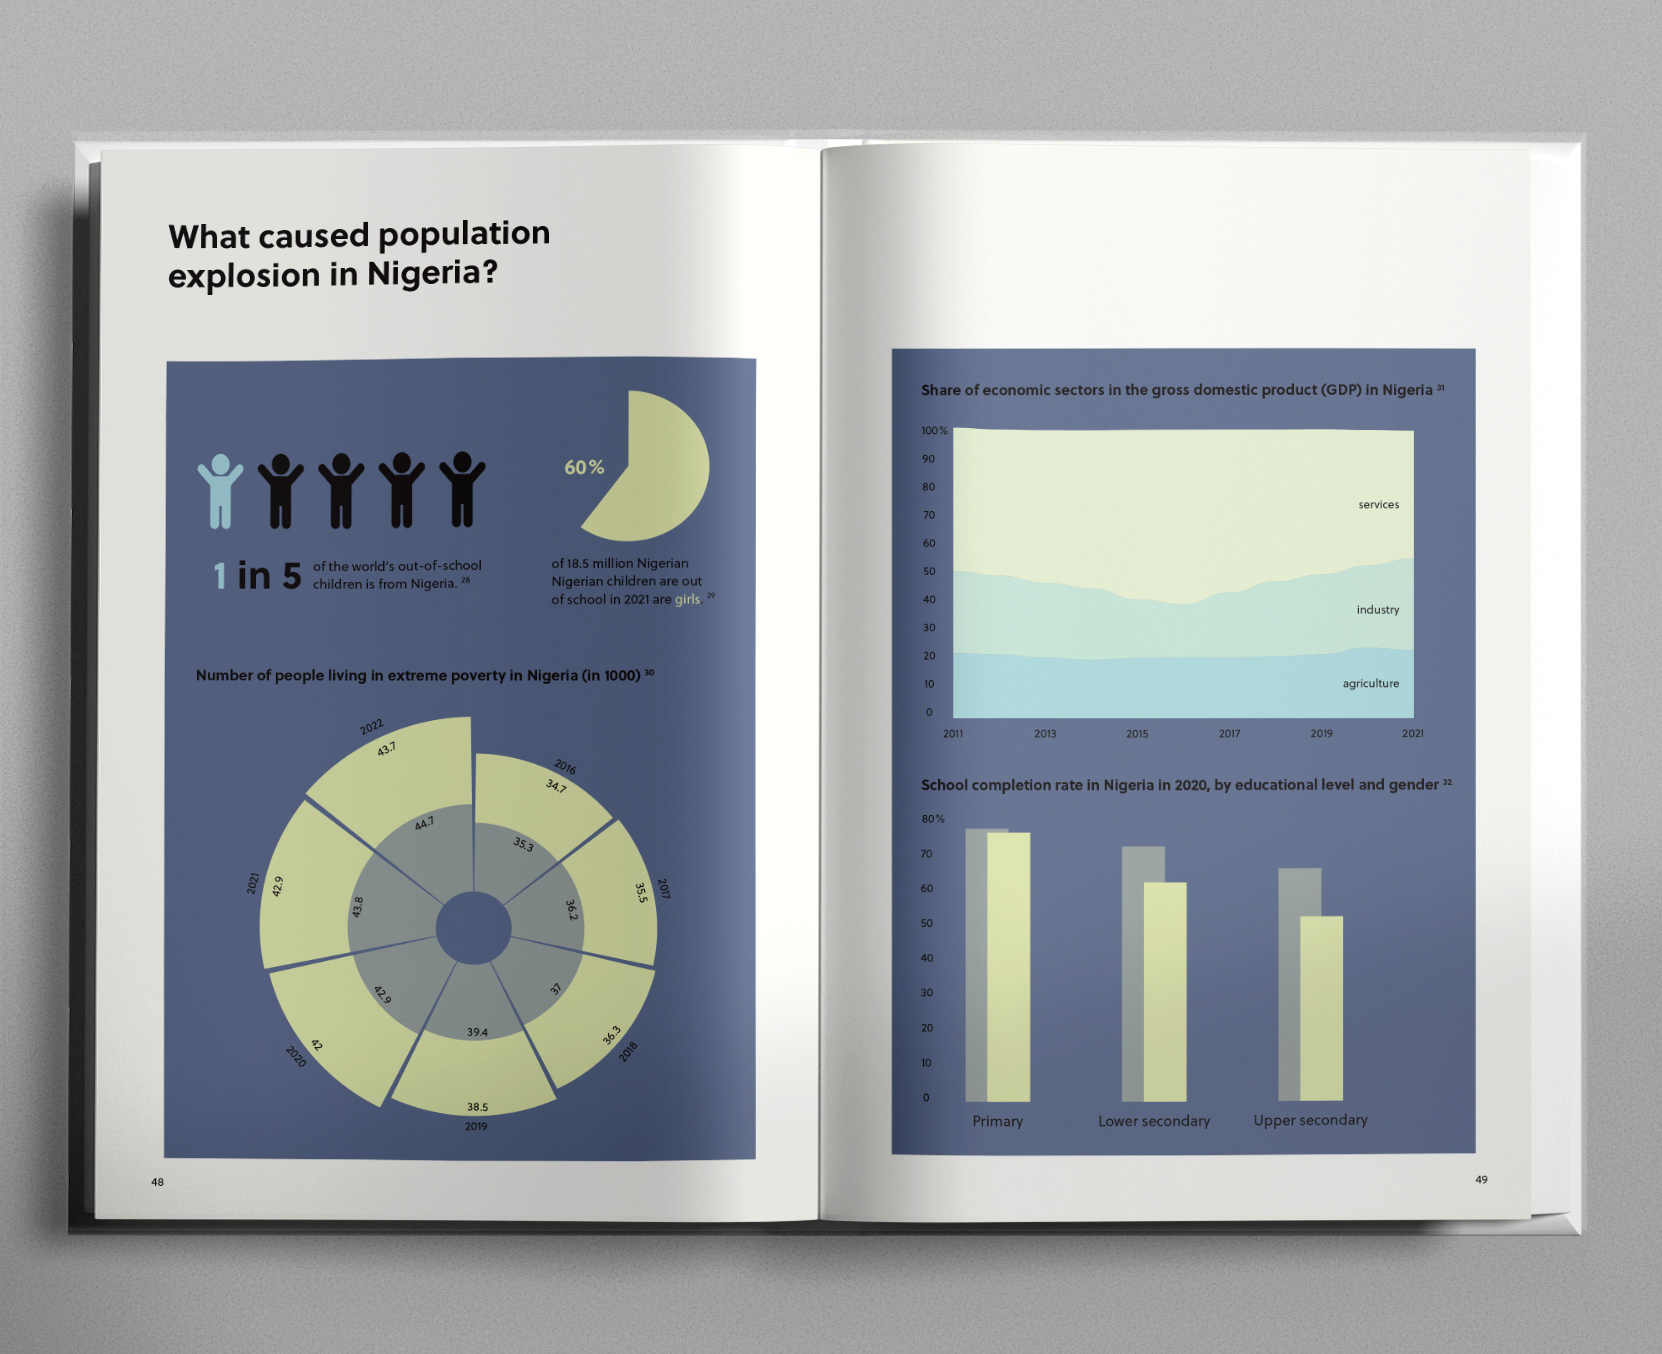
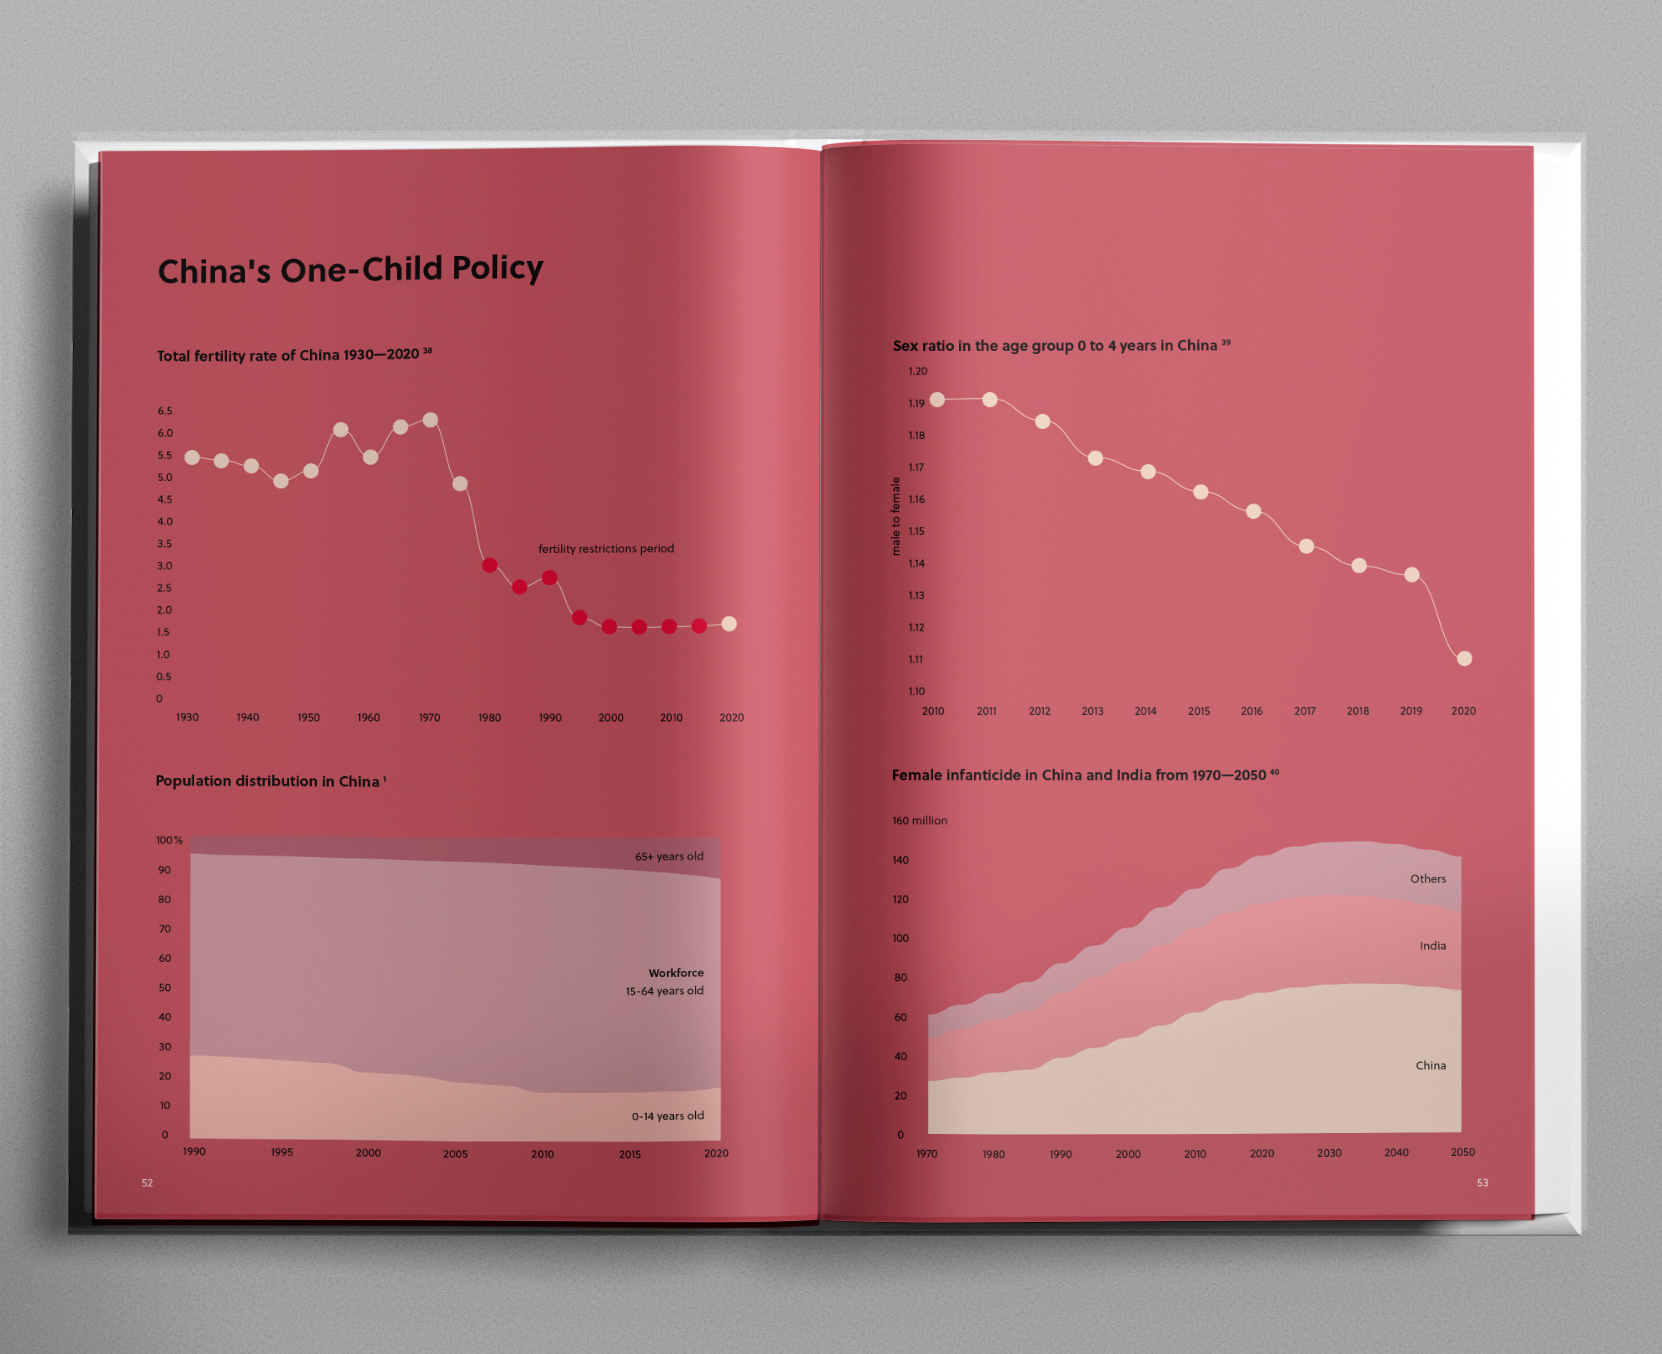
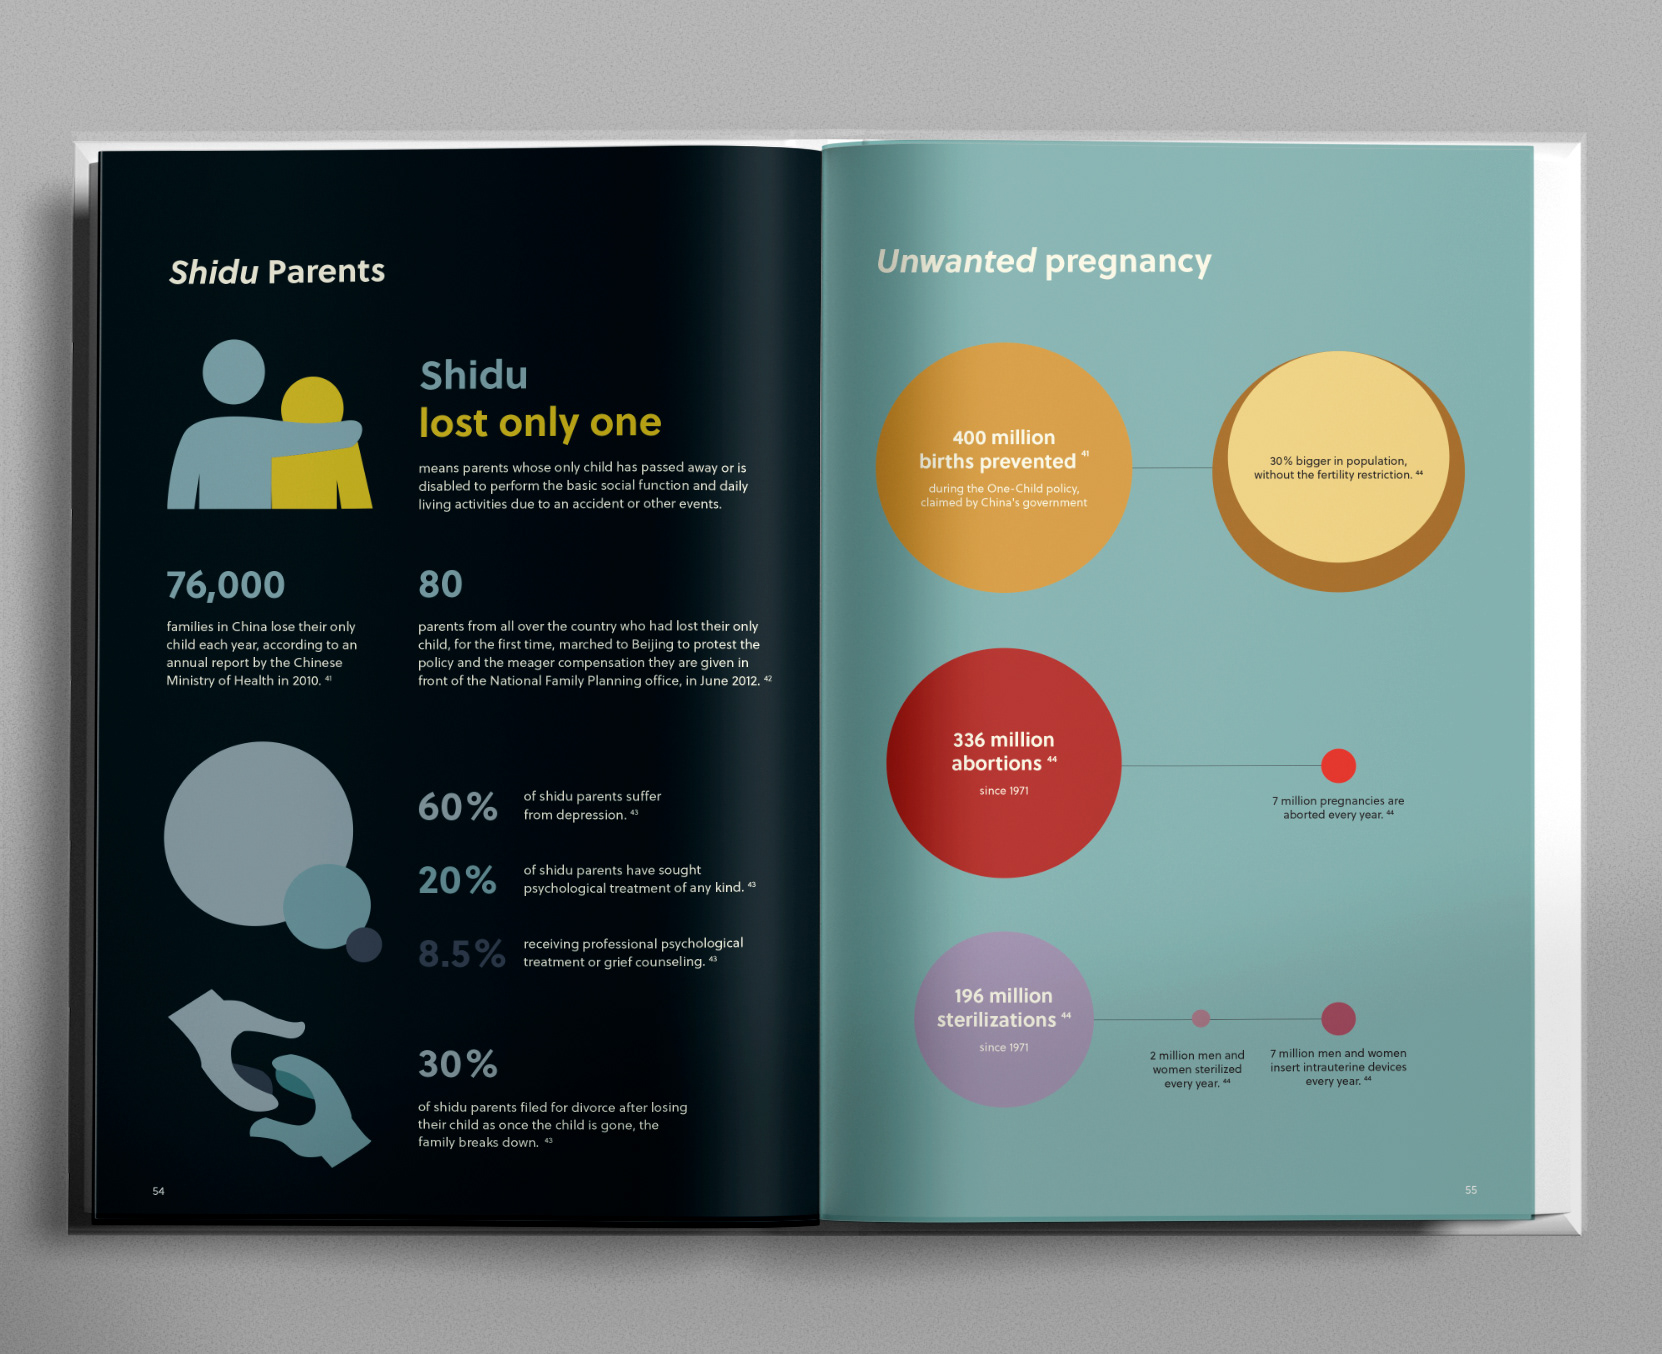
This book project explores a shifting global anxiety: not overpopulation, but underpopulation. Through data visualization and narrative design, Counting the Chickens Before They Hatch presents fertility rates and demographic change in an accessible, visual format for a general audience.
The goal was to make complex population trends both understandable and reflective — encouraging readers to consider not just the numbers, but the people, choices, and values behind them.
the start
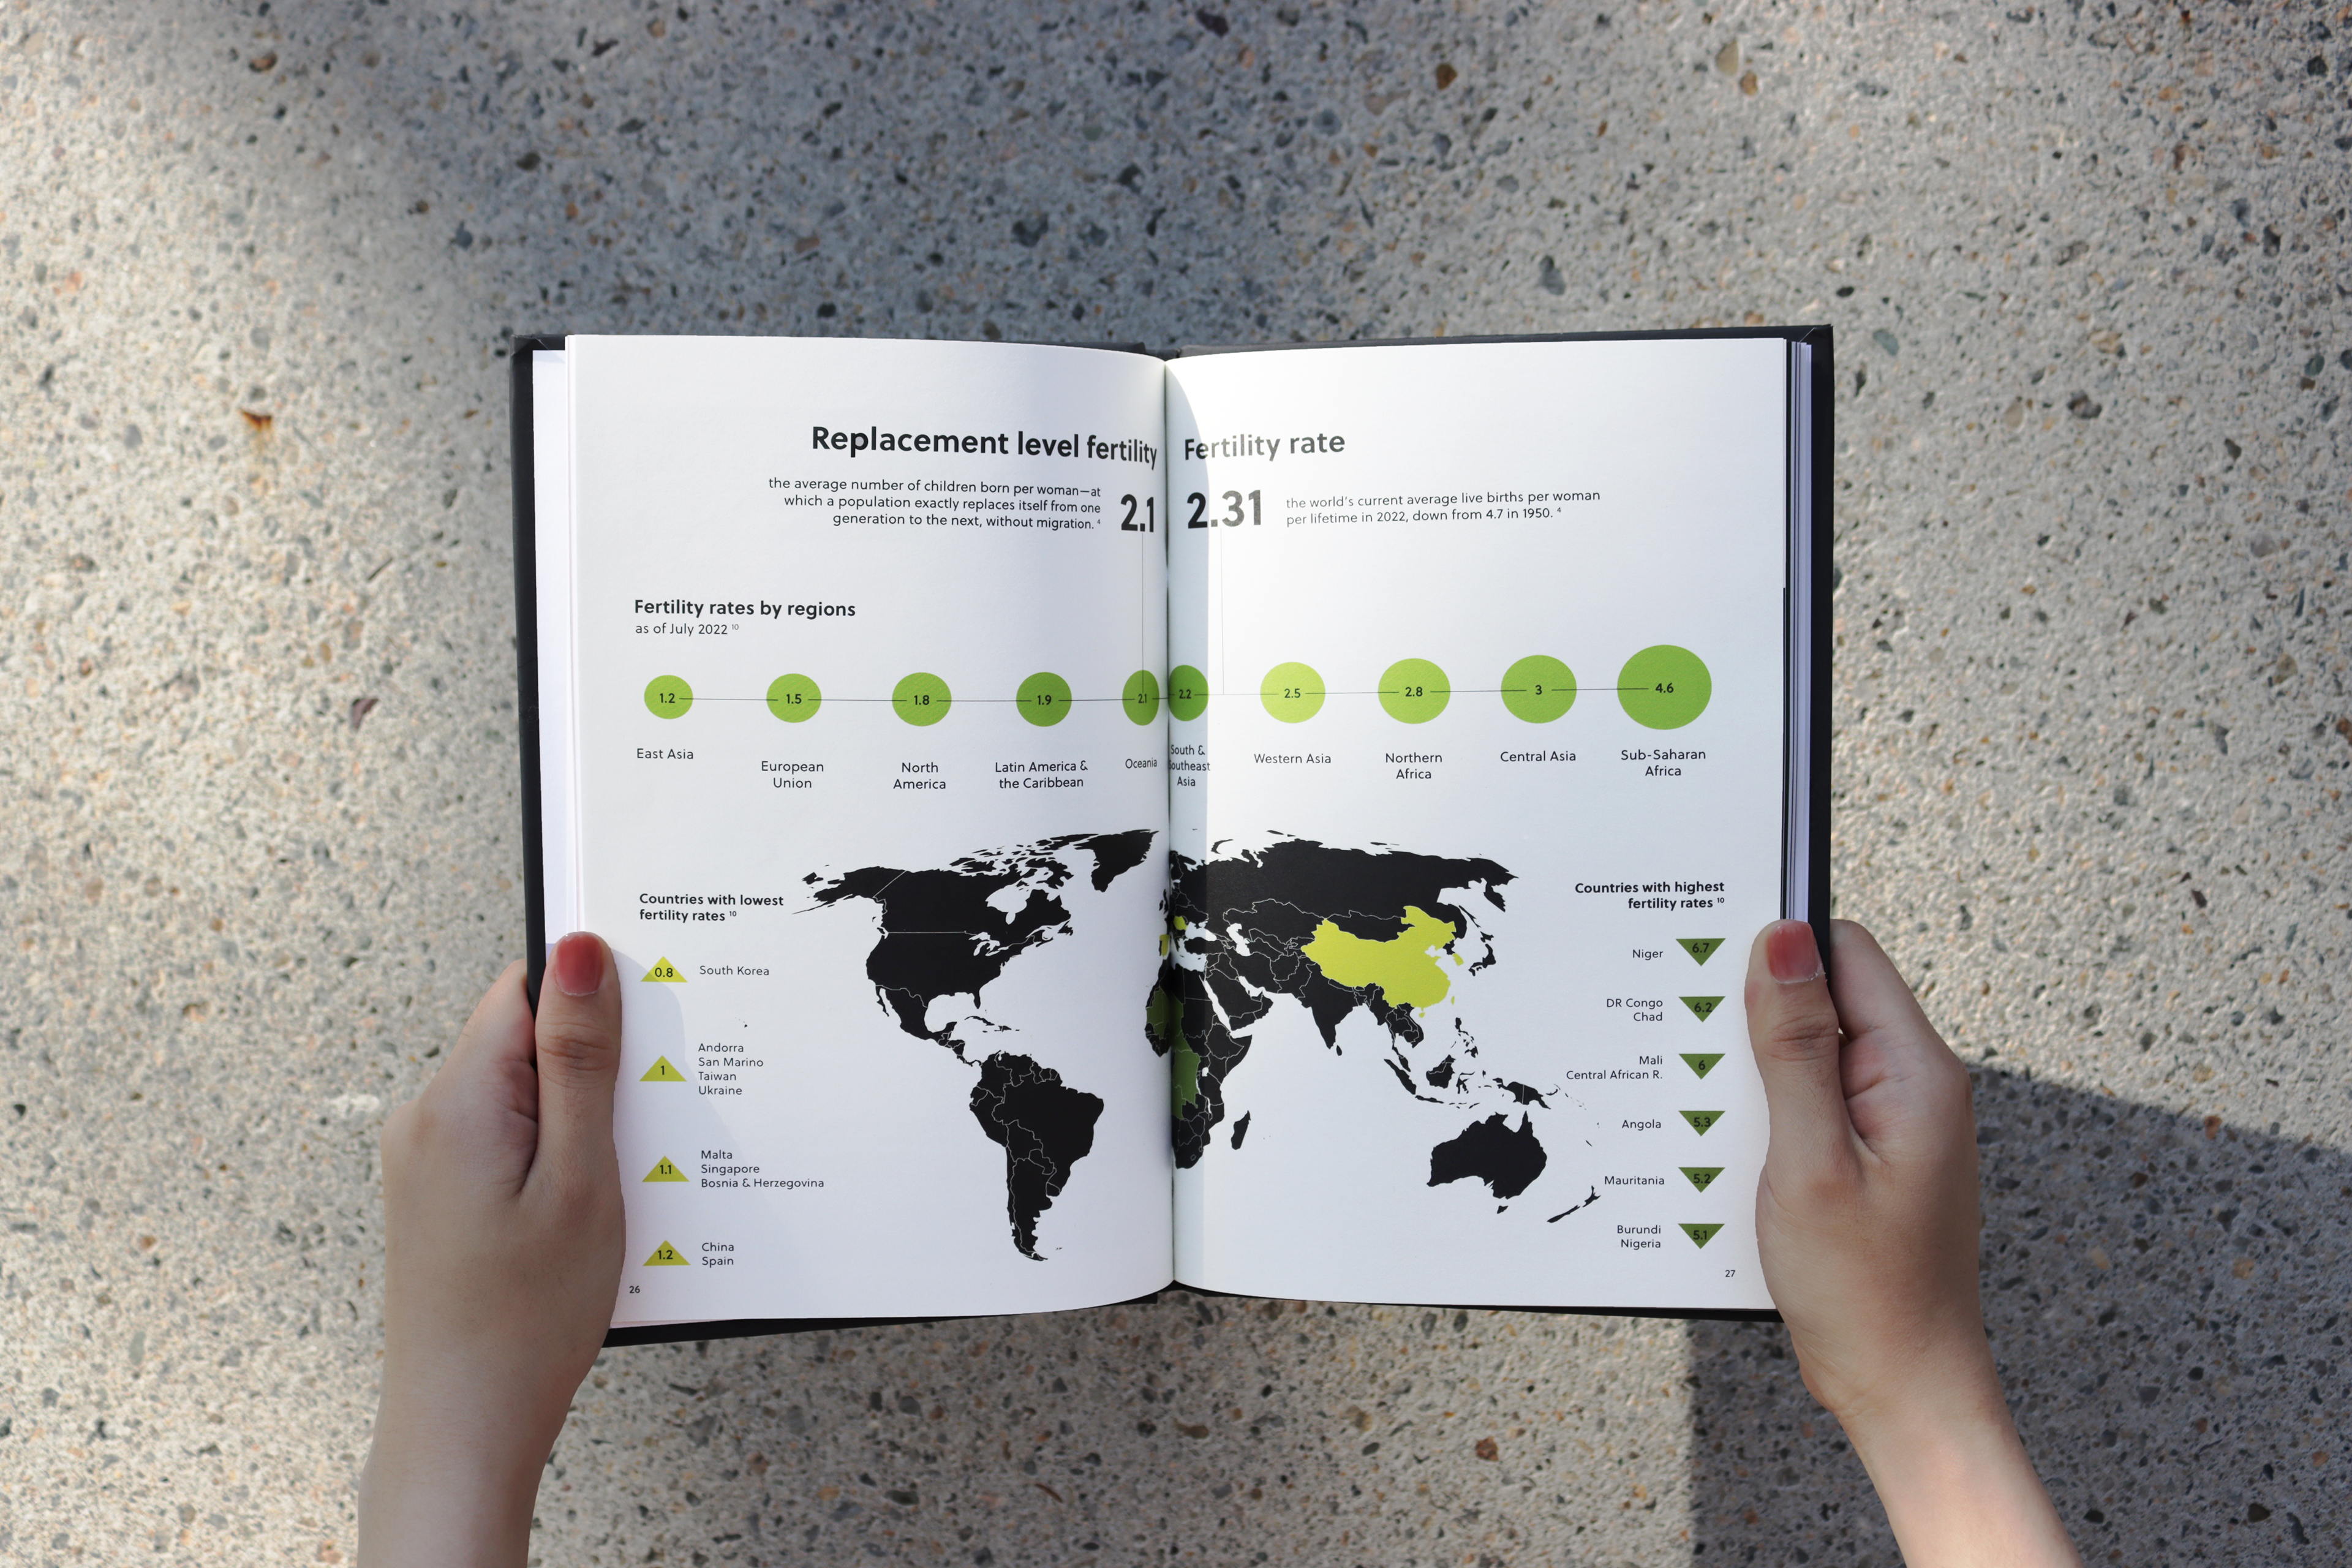
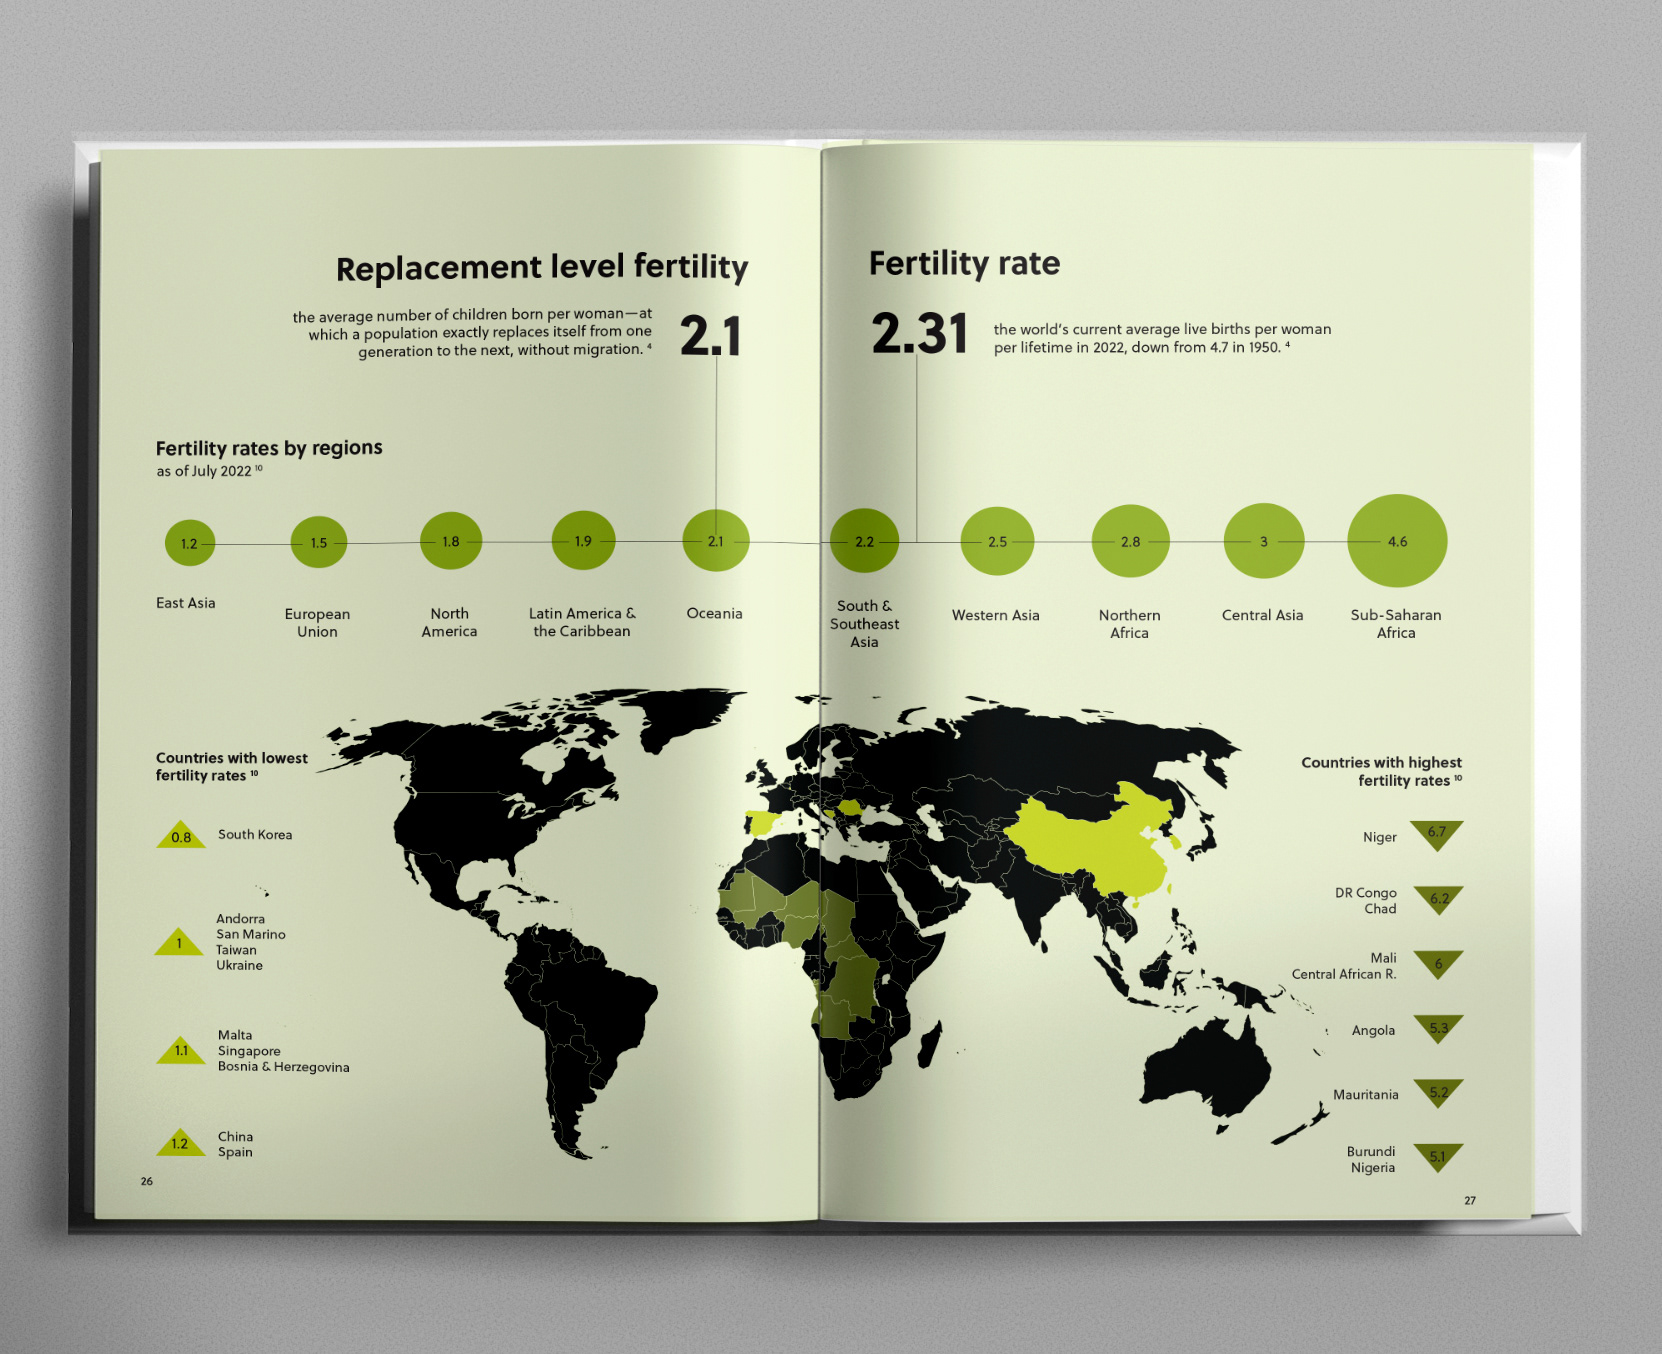
The spark came from a shift in global narrative: from fear of too many people to concern about too few. The concept of replacement-level fertility became the foundation — the idea that societies need 2.1 births per woman to maintain population levels. But who decides whether that's a crisis or a choice?
Is 2.1 the number of children a woman 'should' have?
Guiding Questions
This book doesn't lecture — it prompts reflection:
1. Is the decision to have children personal, political, or both?
2. How do individual choices align (or clash) with national goals?
3. Who feels responsible for a future shaped by fewer births?
Design Approach
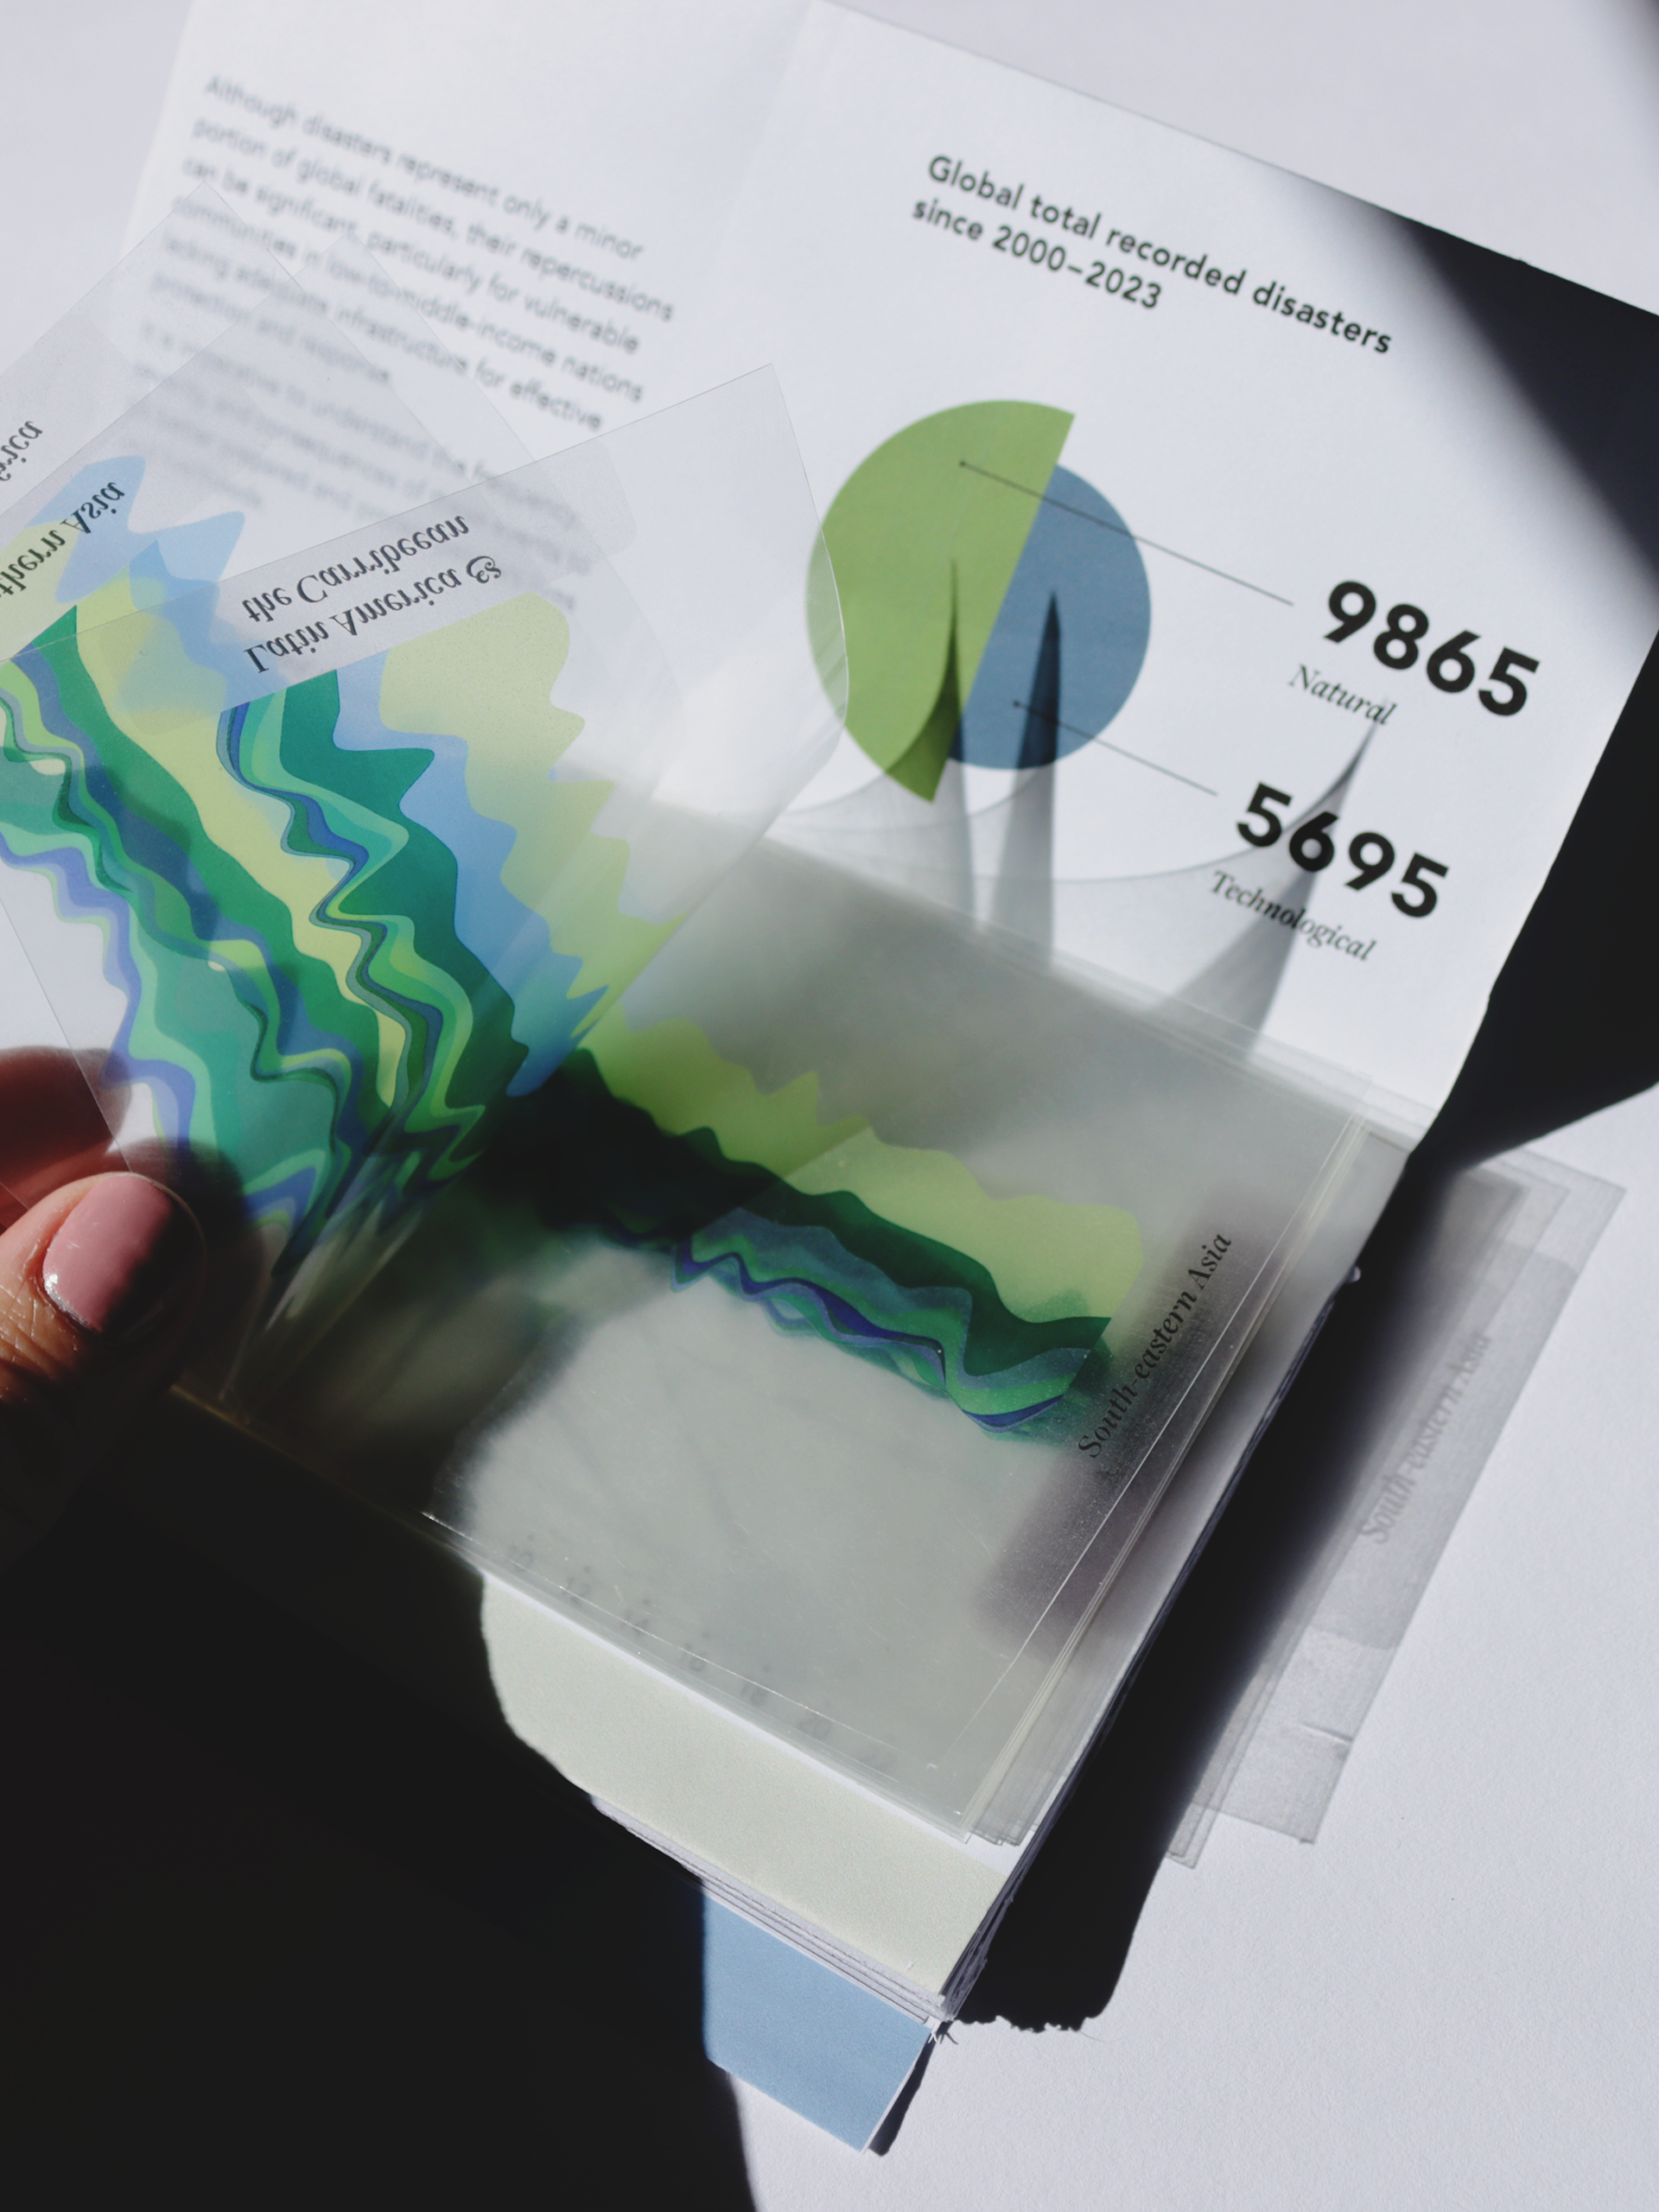
Using techniques from information design and narrative visualization, I structured the book to balance:
+ Statistical clarity with emotional tone
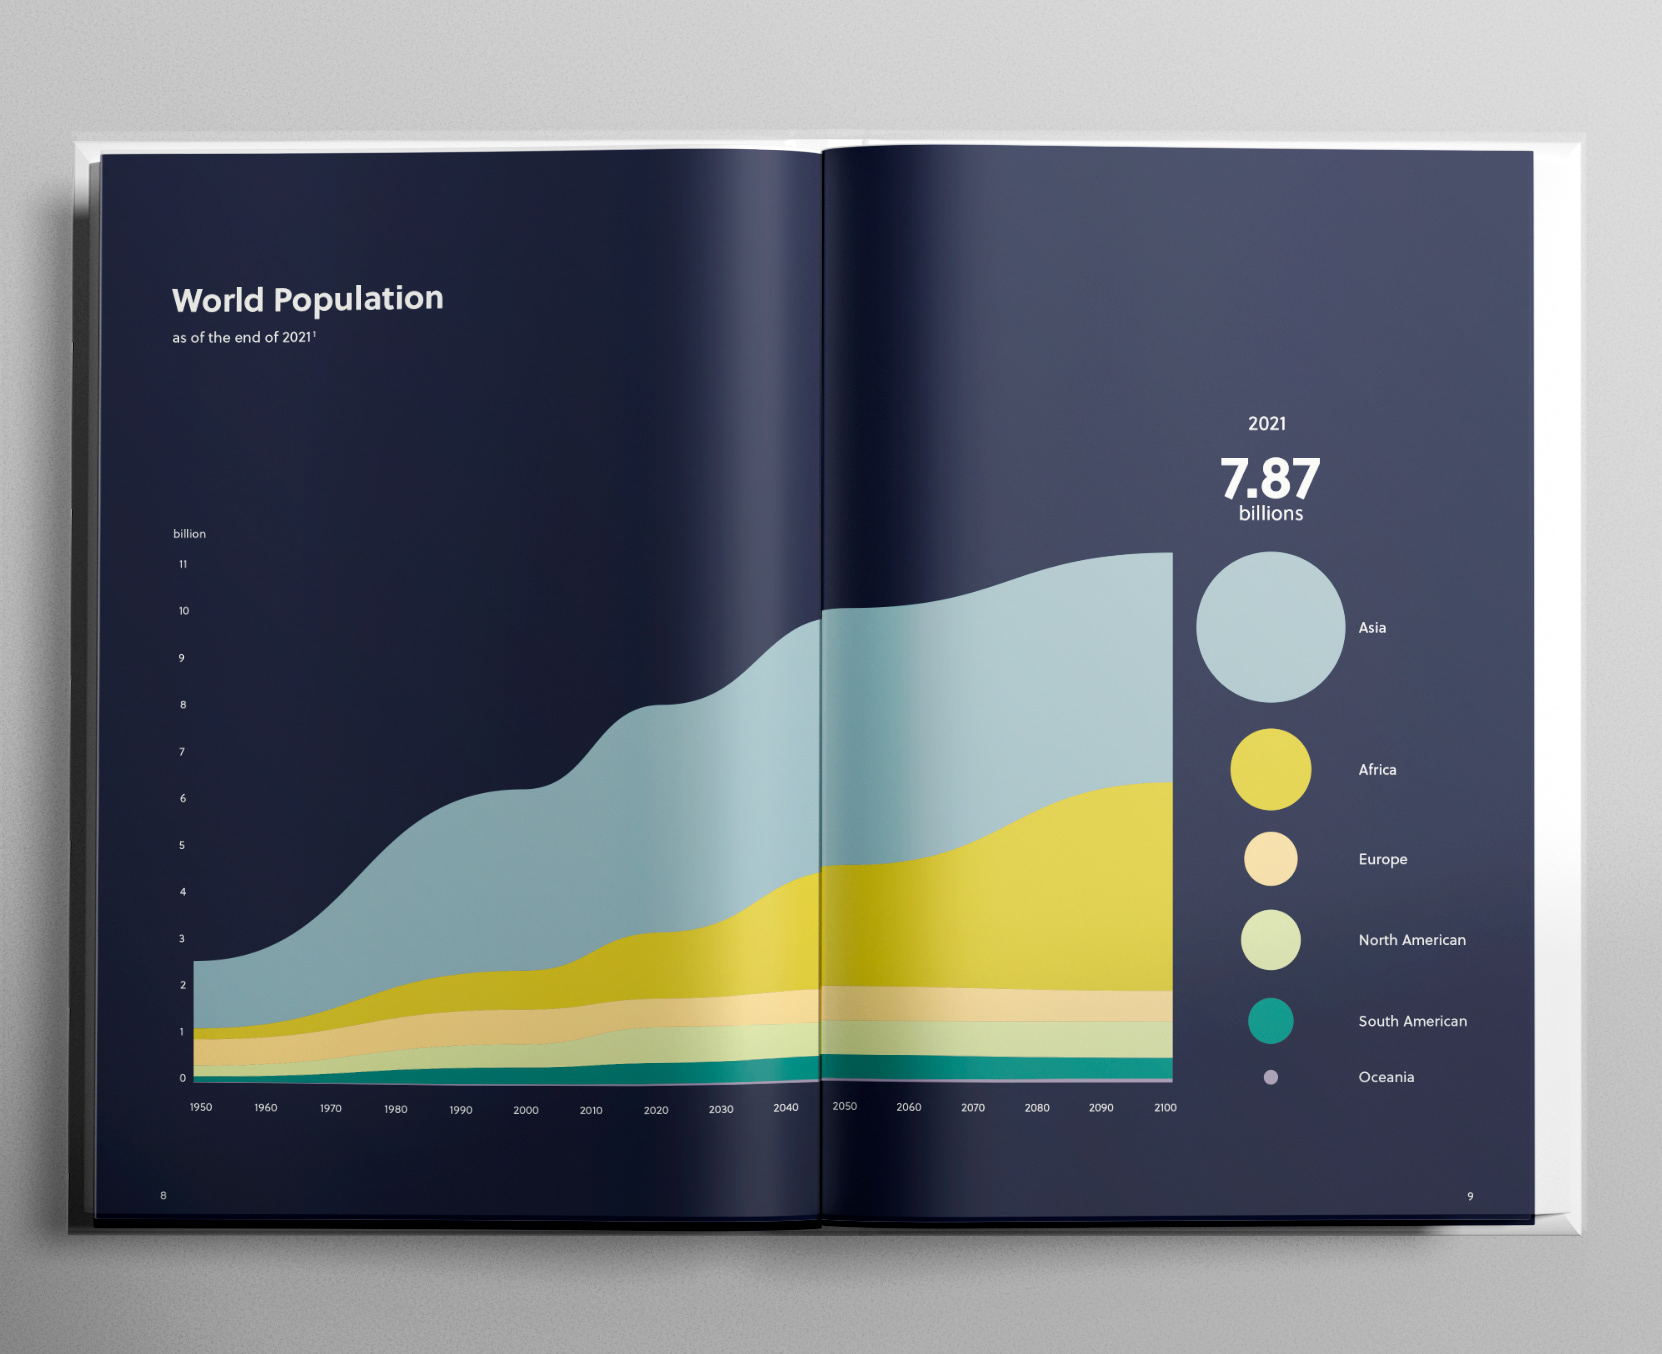
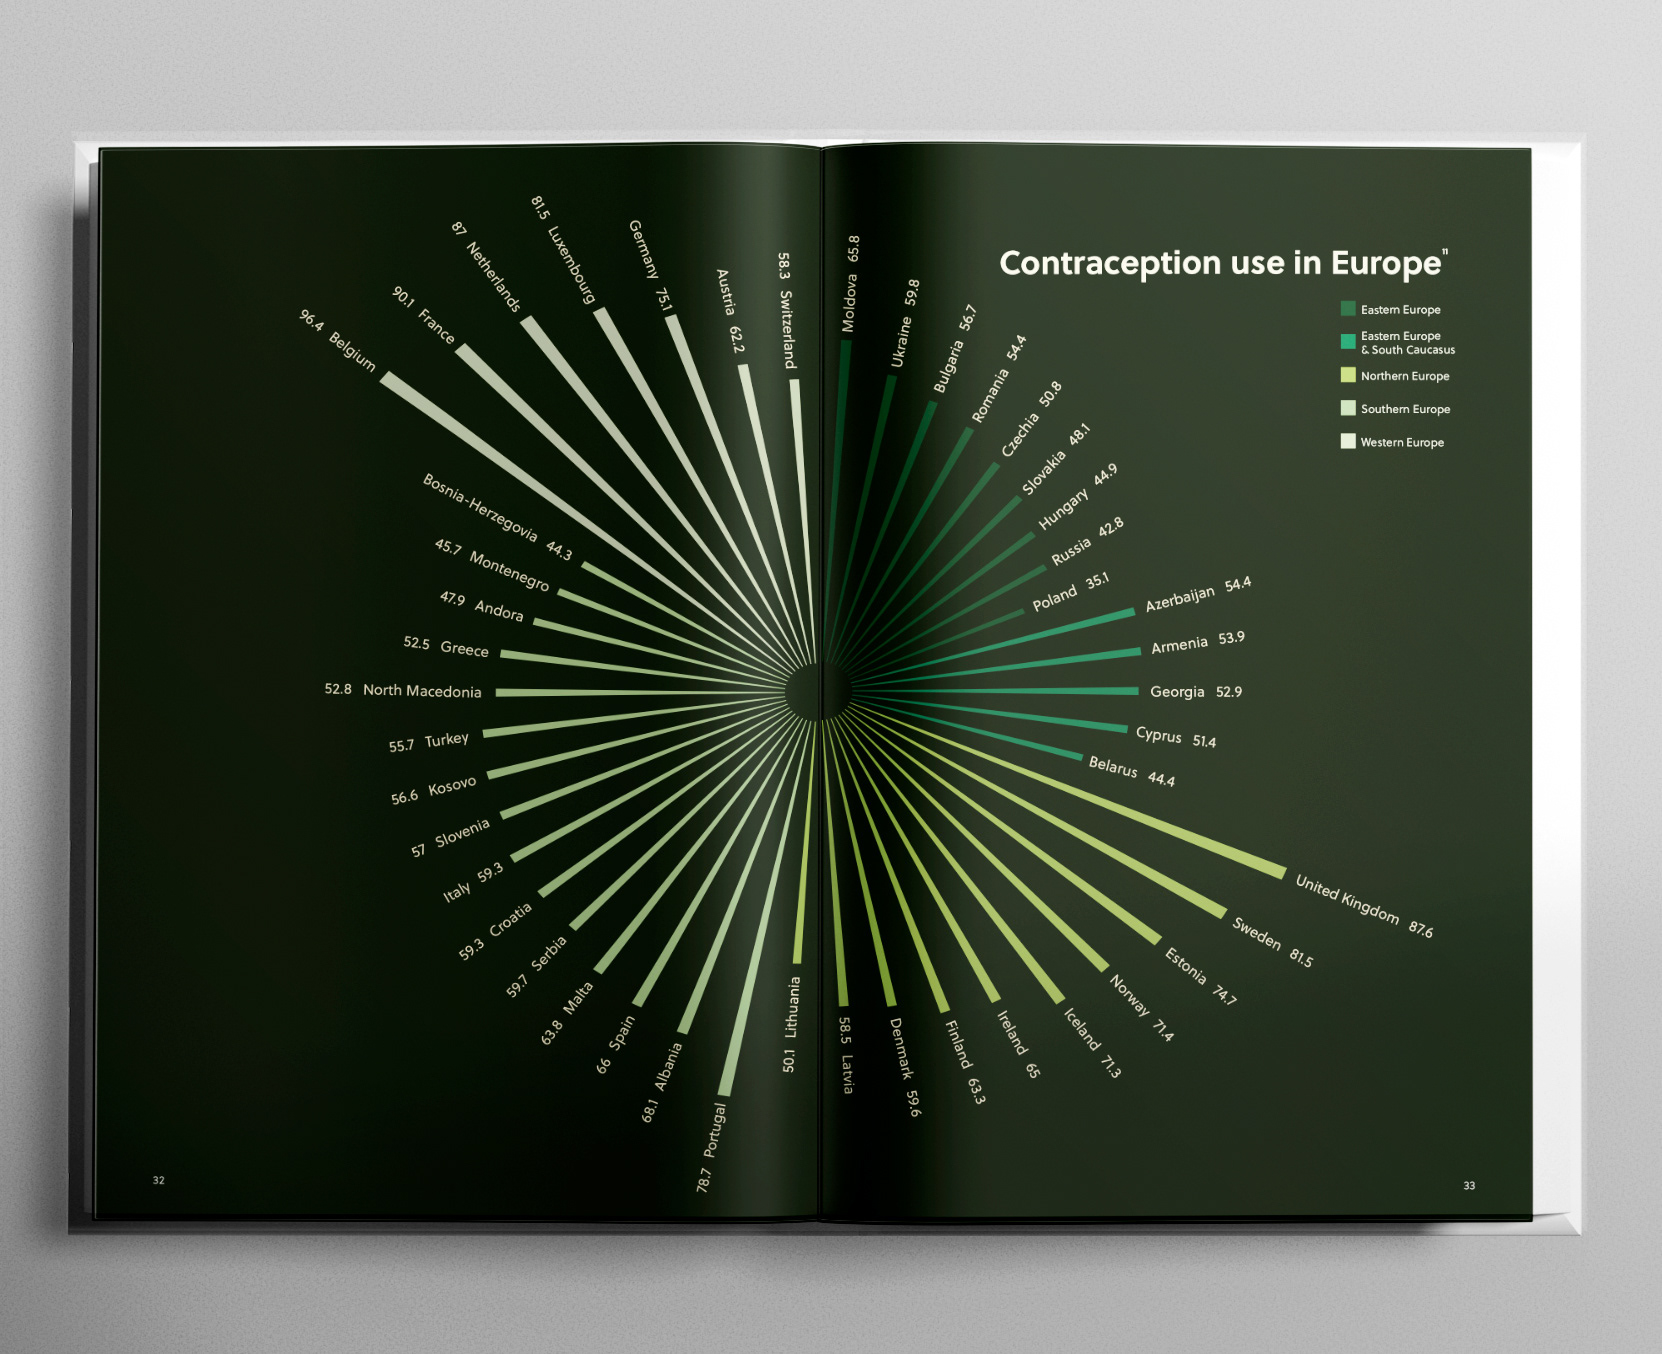
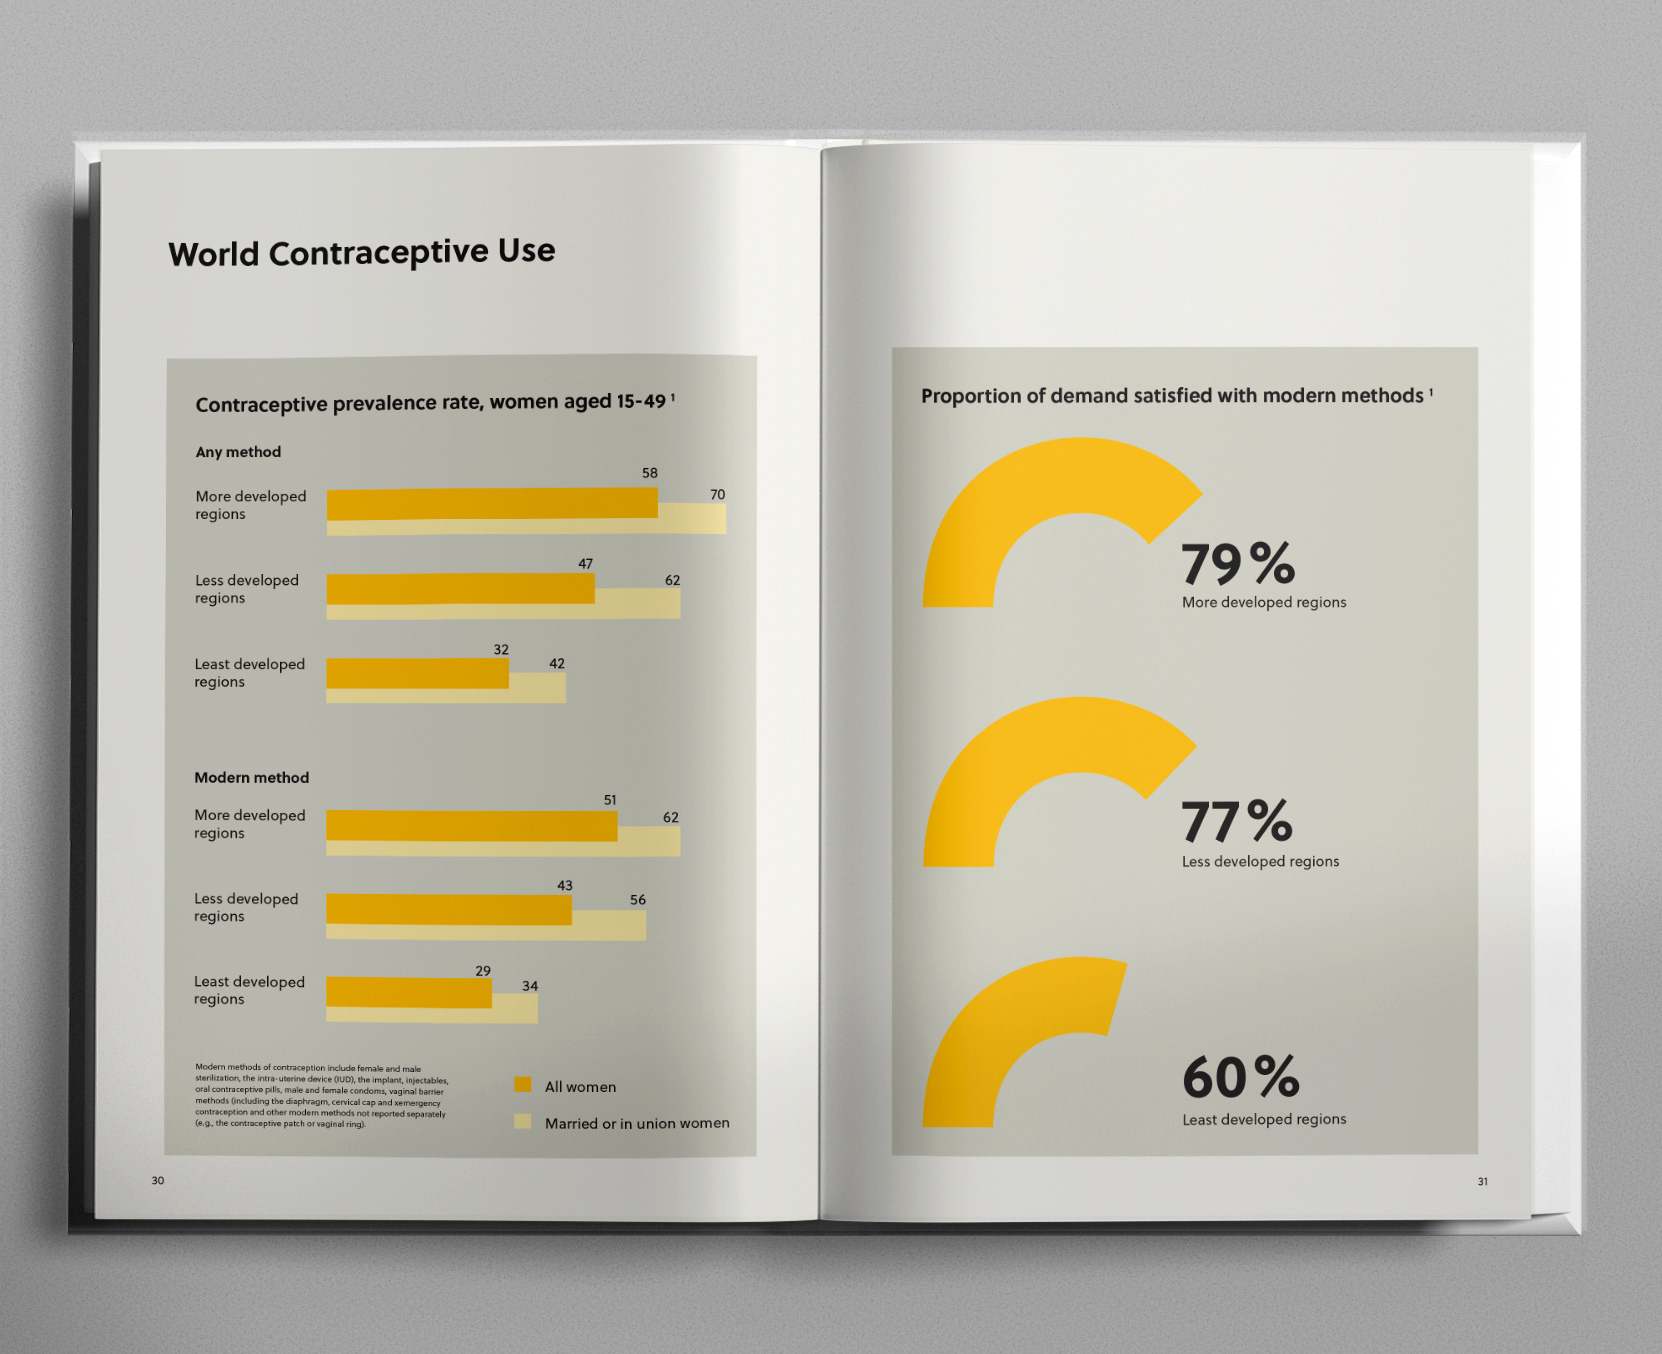
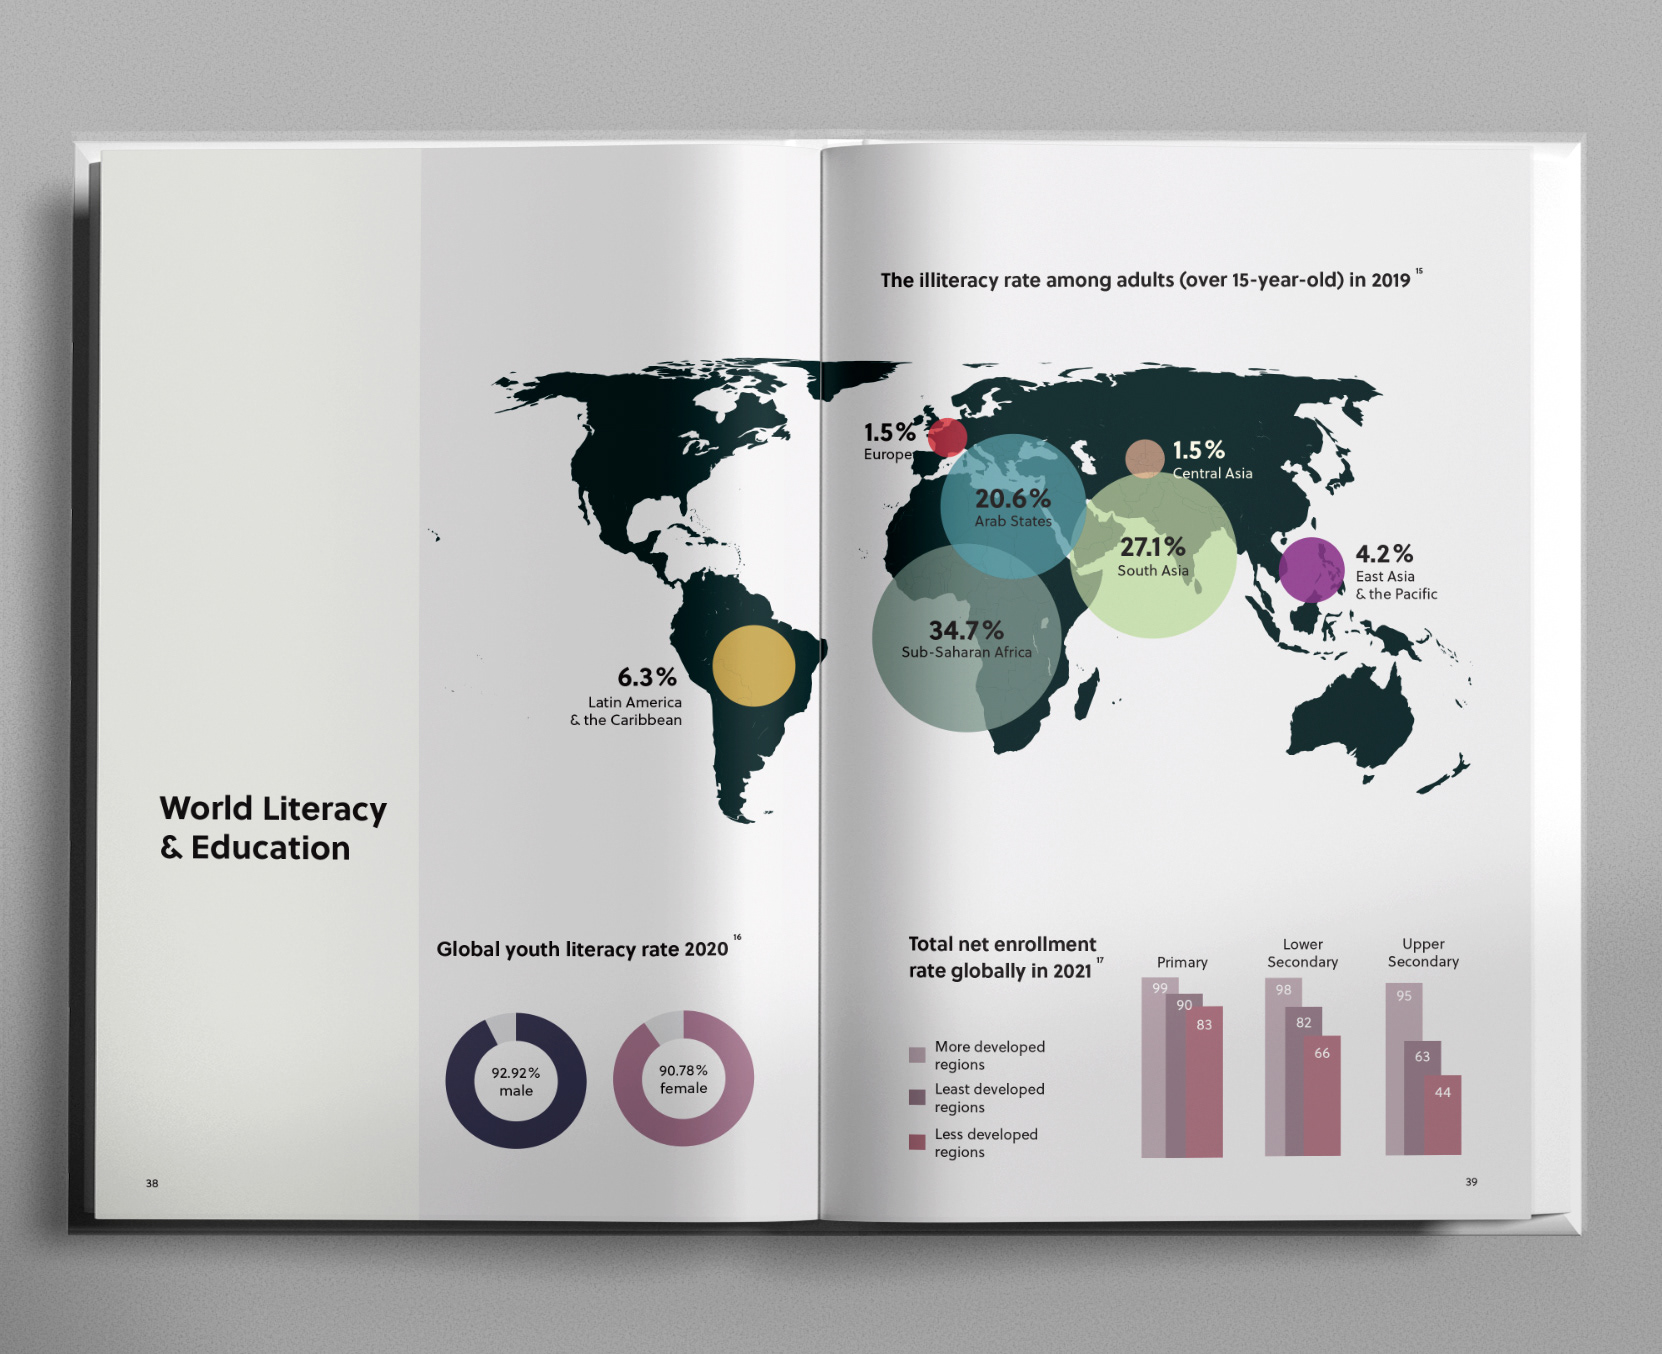
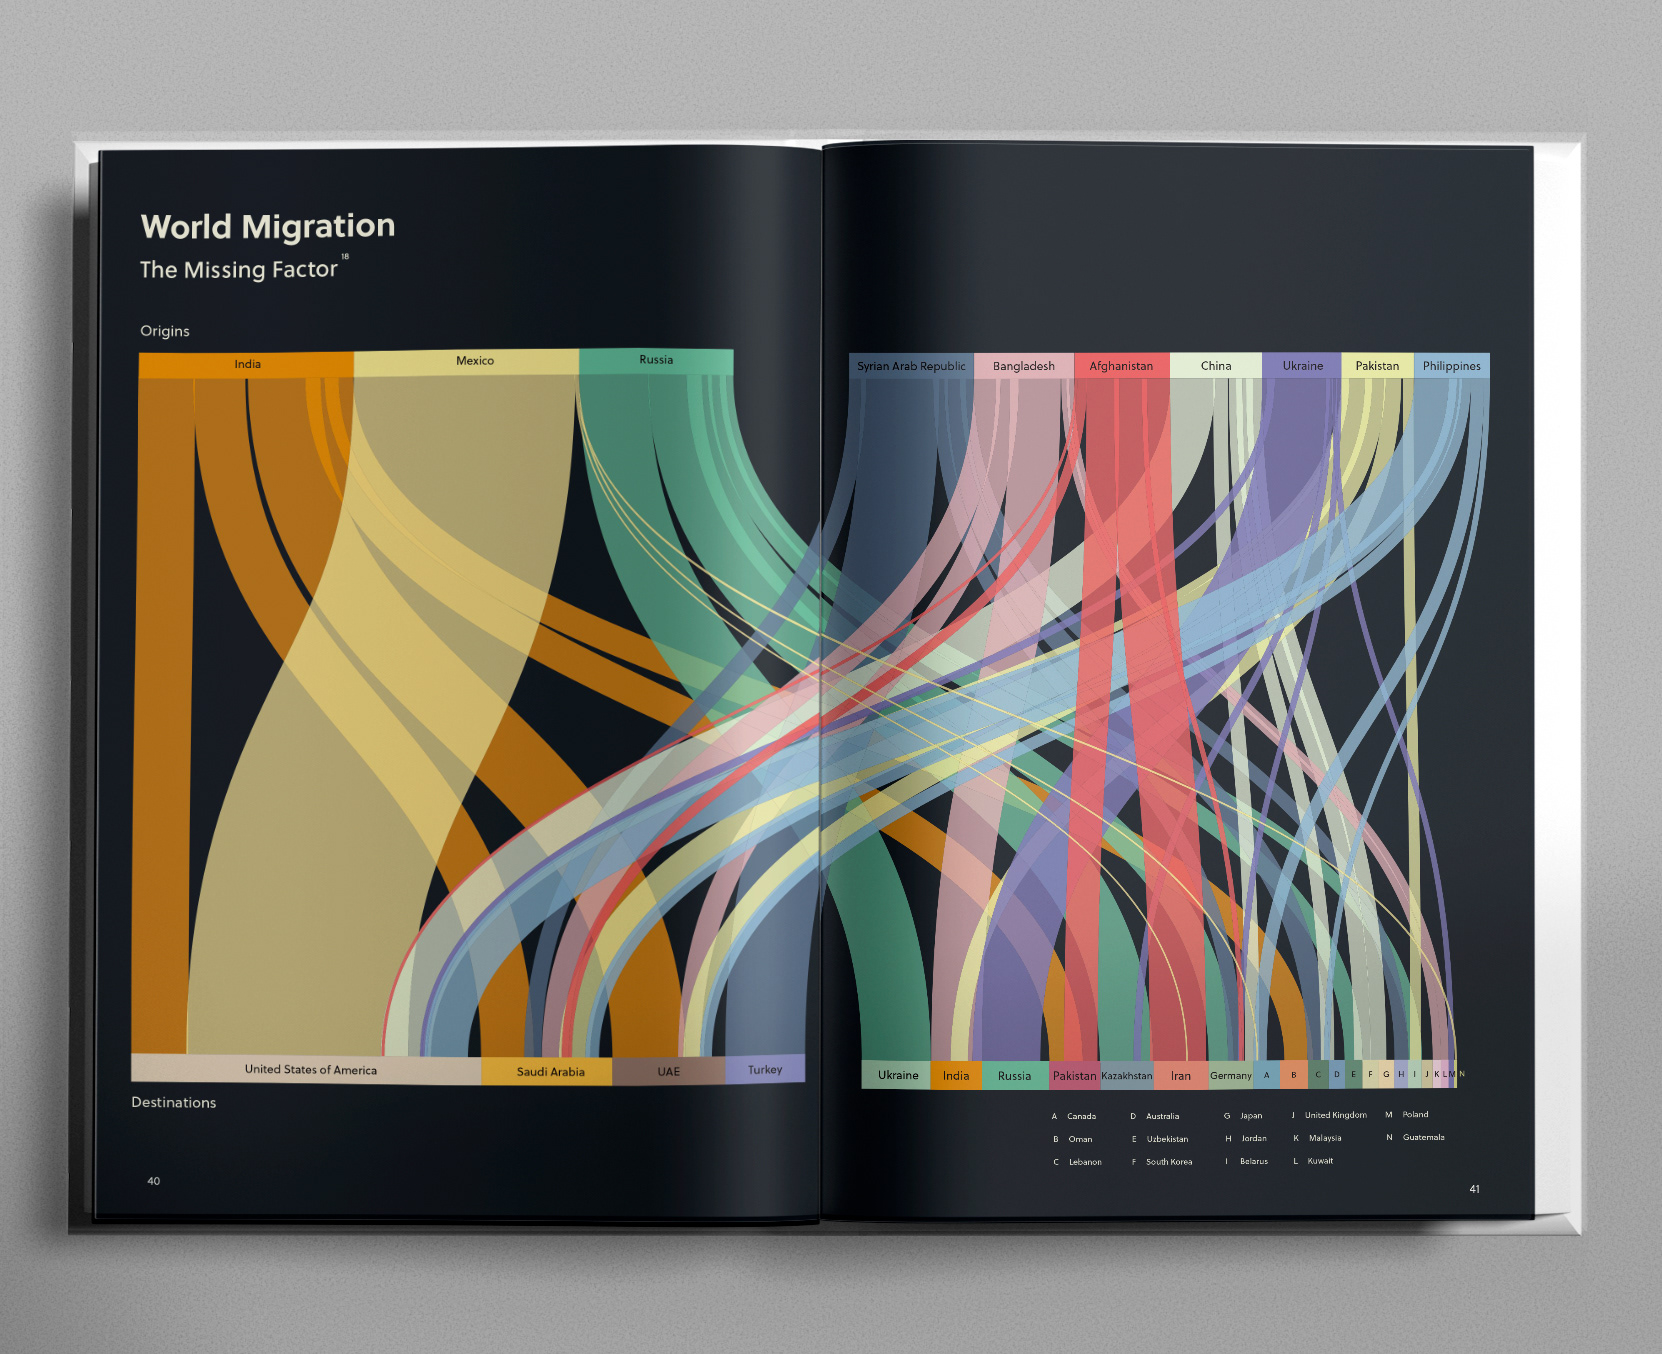
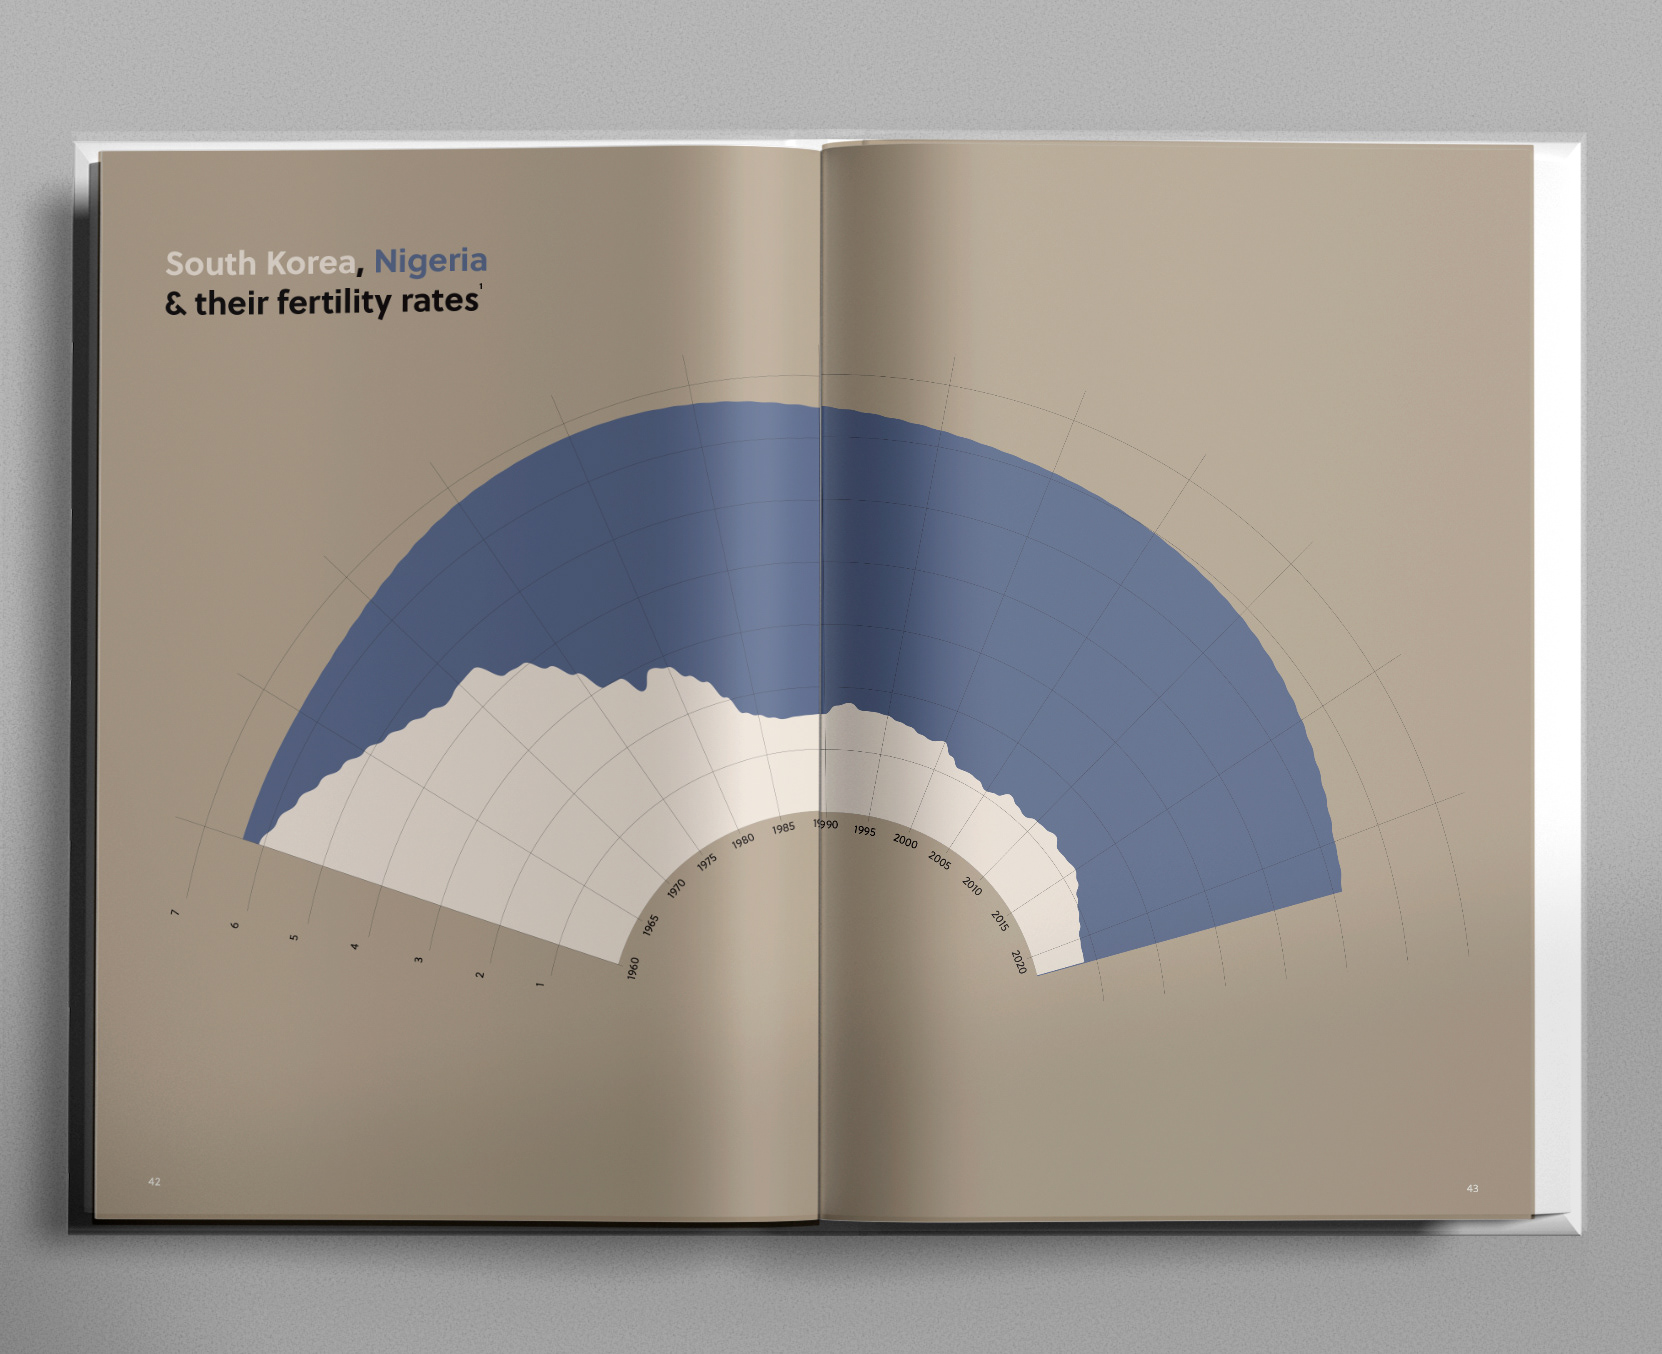
+ Comparative visuals (e.g., country-by-country fertility charts) with story moments
+ Accessible hierarchy to guide non-expert readers through complex patterns
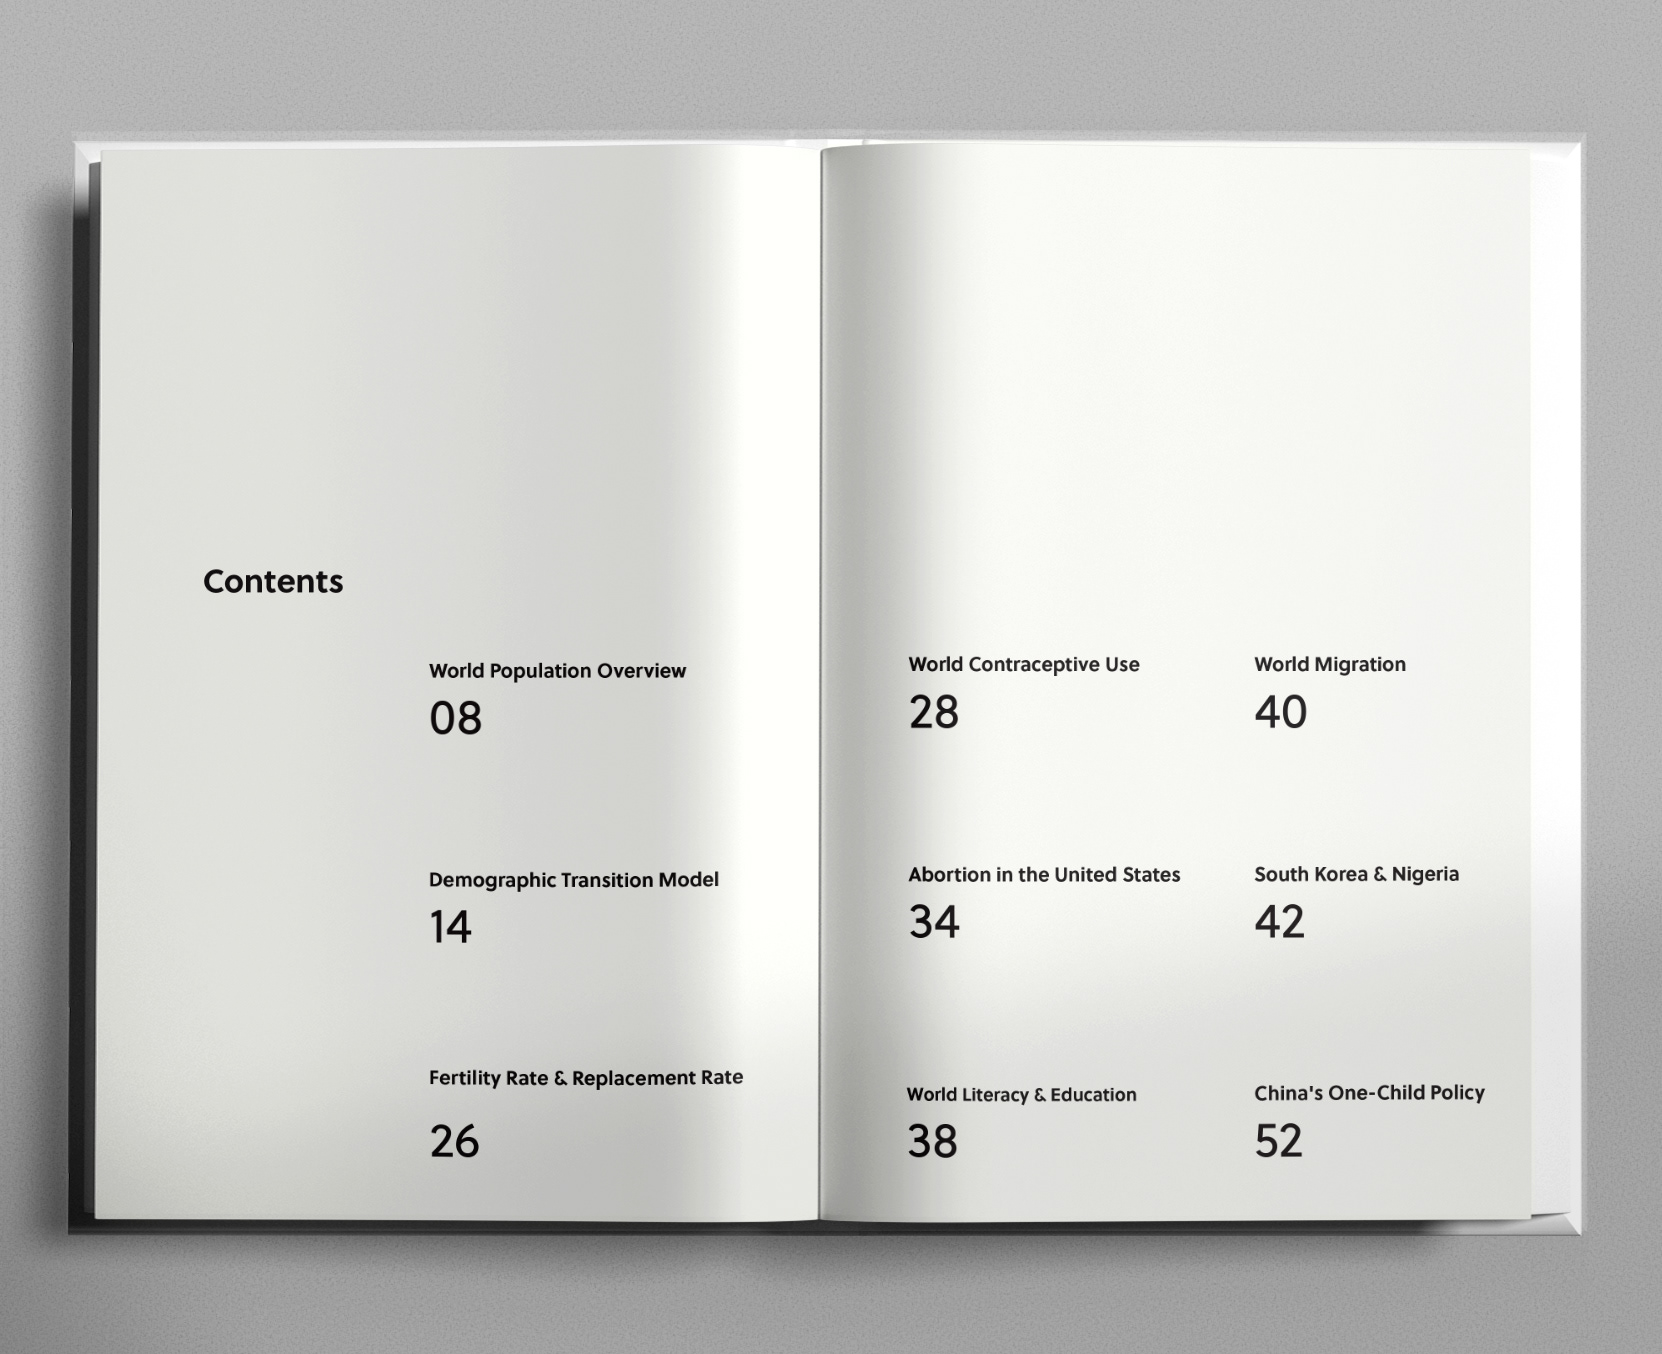
Each page unfolds a different facet of the issue — from family policy incentives to aging economies — encouraging users to interpret, not just absorb.
Reflection
This project deepened my belief that data doesn't have to be neutral — it can provoke, challenge, and create space for empathy. Through visual storytelling, I aimed to make population trends feel less like numbers and more like narratives — stories of futures that are still being written.